 Indicators:
 |

|
|
|


|
Awesome Oscillator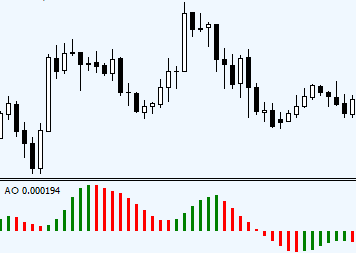
Awesome Oscillator indicatorAwesome Oscillator shows the difference in between the 5 SMA and 34 SMA. What's "awesome" about the Awesome Oscillator?Unfortunately, besides the word "awesome" there isn't much to be impressed with. Forex markets proved to be too unstable for this indicator. On the other hand, if you're trading stocks, Awesome Oscillator will be more interesting to study, since, unlike with currencies, Stock markets sustain longer more stable trends. Let's take a look at the Awesome Oscillator in action by simply comparing it to 5 and 34 SMA on the chart.
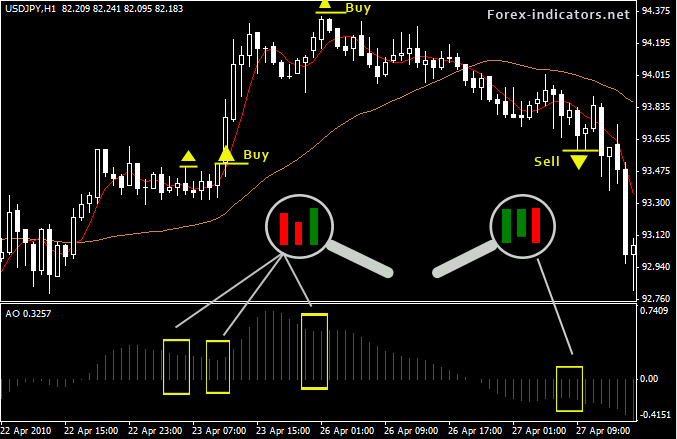
As you can see, the AO mirrors the up and down moves of the 5 SMA in relation to 34 SMA. That said, there are questions to be asked: Does AO gives any additional information besides following the market & showing increase/decrease in momentum which we can be seen with naked eye? - we'd say No. Is AO fast enough to send signals about the market changes and aid us with entries as well as exits? It's No again. Awesome Oscillator is slow and usually late with signals. Practical use of Awesome OscillatorGeneral rules: When AO is above zero - only Buy orders should be taken. Buy signal: Place a pending Buy order above the candlestick which corresponds to the first green bar on the AO histogram. Sell signal: Sell when AO is below zero and there is a series of 3 candles where: Place a pending Sell order below the candlestick which corresponds to the first red bar on the AO histogram.
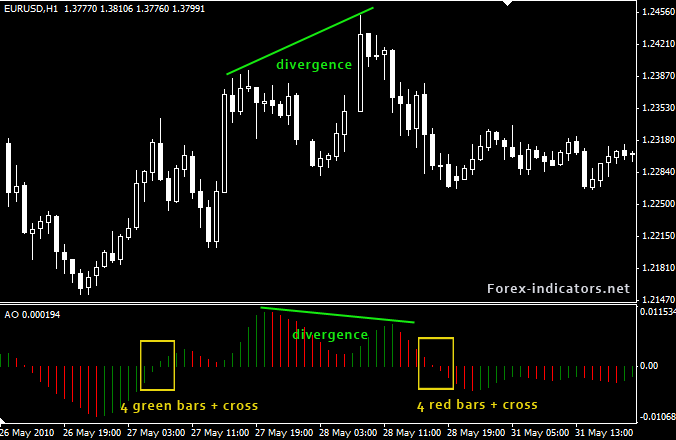
There are 2 other rules for trading with Awesome Oscillator. See examples below:
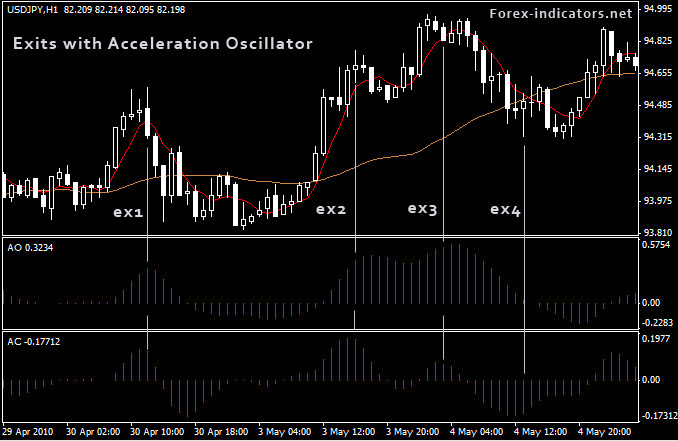
Those two methods aren't used very often, but still have the right to exist and be studied. Combining AO with other indicatorsThere is a known approach of using Awesome Oscillator (AO) together with Acceleration Oscillator (AC). In the highlighted examples below when the AC changed color from red to green and vice verse - this was a signal to exit:
Another suggested method is to combine Awesome Oscillator with Alligator indicator and Fractals, where AO will suggest underlying trend, while a fractal formed above/below Alligator's teeth will invite for an entry. (See fractals page for details). Awesome Oscillator formulaAwesome Oscillator = SMA (MEDIAN PRICE, 5) - SMA (MEDIAN PRICE, 34) MEDIAN PRICE = (HIGH+LOW)/2 Where: SMA - Simple Moving Average Copyright © Forex-indicators.net Comments |

 Download:
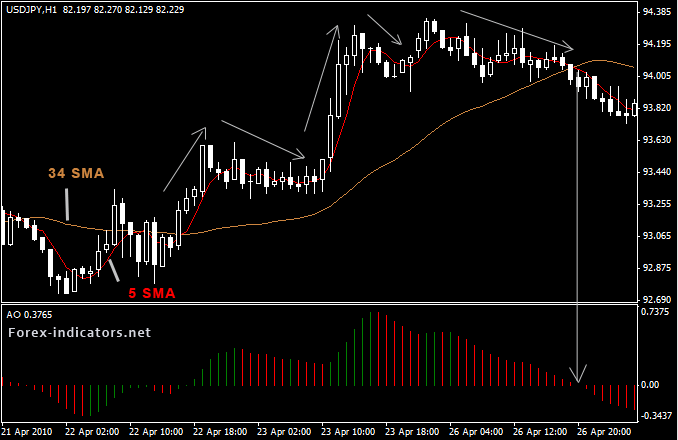
Please change the background to light grey or light blue. The black background makes the chart very difficult to read when printed.
great stuff!
completely disagree with your statement that currencies do not trend like stocks. everybody knows the opposite is true.
Currencies do trend, but not as good as stocks.
They do trend as well as stocks, simply with more volatility during their trends. But you must look at the longer time frames to see this. Compare a 1h to a 4h or Daily to a Weekly chart and you'll see what I mean.
I just discovered your website, and I'm very impressed that I can understand and apply the concepts in my future trades. Thank you!
I use a custom version called Awesome_Signal_Alert which allows one to change the default values. I change the fast sma from 5 to 4. It becomes one of the most reliable indicators for confirming (not signalling) a buy or sell signal condition generated by other indicators. The oscillator must be green or above zero for long and red or below zero for a short order. It's a little slow sometimes on reversals but very accurate for confirming trends for continuation signals. It filters out a lot of the noise very well.
Thank you!
Downloads:
Awesome_Signal.mq4
Awesome_Signal_Alert.mq4
What is an Acceleration Oscillator? How is it computed?
You refer to it, and illustrate it in the last screen shot of the Awesome Oscillator.
Excellent trading indicators, they are working very nice with any time frame
thank you.....
What is the AC looking at? is it a volume indicator or Moving average indicator
GOOD
Post new comment