Bollinger Bands – a simple yet powerful indicator, ideal for traders who like visual style of trading.
Bollinger Bands: quick summary
Created by John Bollinger, the Bollinger Bands indicator measures market volatility and provides a lot of useful information:
- trend direction
- trend continuation or pausing
- periods of market consolidation
- periods of upcoming large volatility breakouts
- relative market tops and bottoms and price targets.
Bollinger Bands interpretation
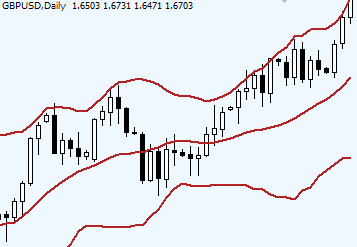
Bollinger Bands indicator consists of three bands, which 85% of the time retain price within their boundaries:
- Simple moving average (SMA) in the middle (with default value of 20)
- Lower band - SMA minus 2 standard deviations
- Upper band - SMA plus 2 standard deviations
The default value for Bollinger Bands in Forex is (20,2) - the settings we'll be using for our screenshots.
When the market becomes more volatile, the bands will correspond by widening and moving away form the middle line. When the market slows down and becomes less volatile, the bands will move closer together.
How to trade with Bollinger Bands
Price moves in upper bands channel – uptrend, lower - downtrend
It is very simple to identify dominating price direction by simply answering the question: in what part of the Bollinger Bands the price is currently trading? If price stays above the middle line – in the upper channel – we’ve got a prevailing uptrend. If below the middle line – in the lower channel – we have a prevailing downtrend.
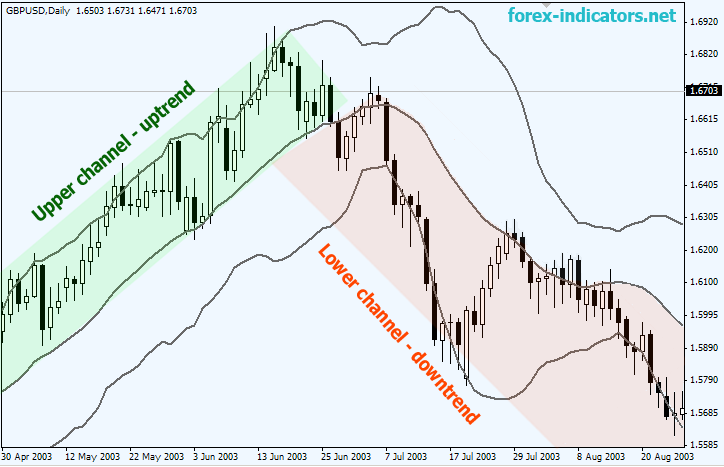
And just in case you’ve missed the beginning of the trend, Bollinger Bands can help you get in the trend with good risk to reward ratio on a pullback.
Simply look for dips towards the middle Bollinger Bands line and enter in the direction of the trend.
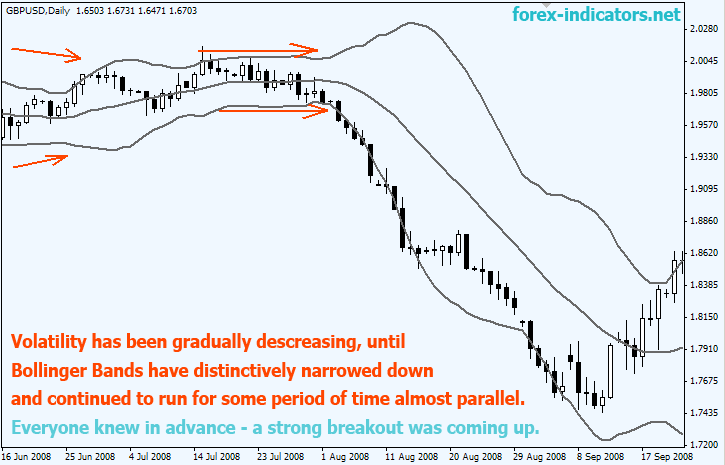
Low volatility, followed by high volatility breakouts
When Bollinger Bands start to narrow down to the point when they are visually forming a neat tight range (measured no other way than by eye), as shown on the screenshot below, the situation signals of an upcoming increase in volatility once market breaks outside the bands. It is similar to a quiet time before the storm.
The more time passes while price is contained within the narrow Bollinger Bands range, the more aggressive and extensive breakout is expected.
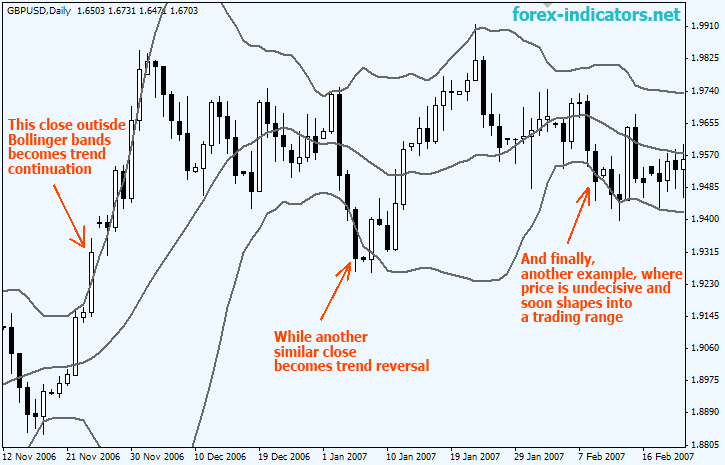
Price moves outside the bands – trend continuation
When price moves and closes outside the Bollinger upper or lower bands, it implies a continuation of the trend. With it Bollinger Bands continue to widen as volatility rises.
But it is not always straight forward: at some point closing outside Bollinger Bands will mean price exhaustion and upcoming trend reversal.
Bollinger Bands alone are not able to identify continuation and reversal patterns and require support from other indicators, such as often RSI, ADX or MACD – in general all types indicators that highlight markets from a different than volatility and trend prospective (momentum, volume, market strength, divergence etc).
Trend reversal patterns with Bollinger Bands
As a rule, a candle closing outside Bollinger Bands followed later by a candle closing inside the Bollinger Bands serves as an early signal of forming trend reversal. It is, however, not a 100% assurance of an immediate trend reversal.
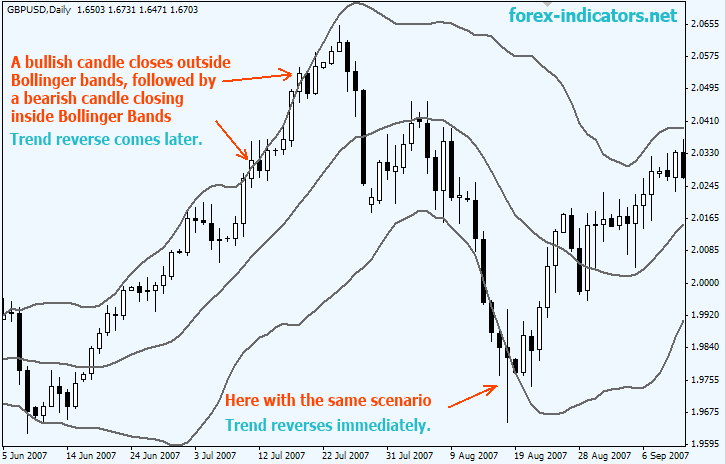
Since long aggressive trend develop not that often, there will be on general more reversals than continuation cases, still only filter signals form other indicators may help to spot true and false market tops and bottoms.
Speaking of the last, Bollinger Bands are also capable of aiding double top and double bottom pattern recognition and trading.
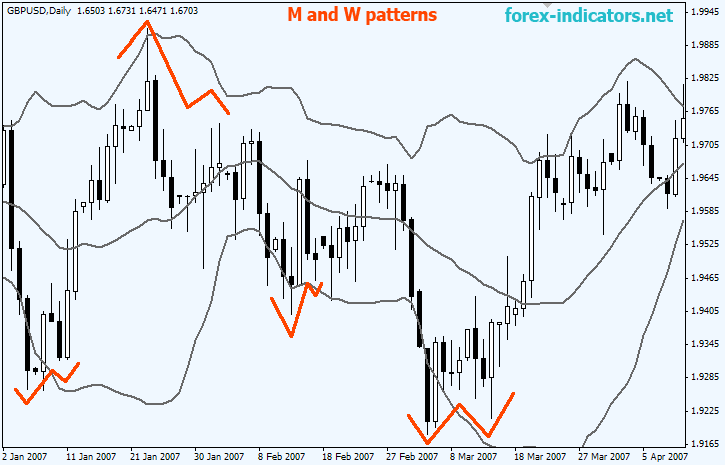
W and M patterns with Bollinger Bands
A double top or M pattern is a sell setup. With Bollinger Bands it occurs when the following sequence take place:
- price penetrates the lower band,
- pulls back toward the middle line,
- a new subsequent low is formed, and this low is above the lower band and never has touched it.
- a setup is confirmed when price reaches and crosses the middle Bollinger line.
In fact, a very conservative trading approach requires price to cross and close on the other side of Bollinger Bands middle line before the trend change is confirmed.
As you have probably noticed, the middle Bollinger Bands line is simply a 20 SMA (default) line. This Simple Moving Average (SMA) is by itself a widely used stand alone indicator, which help Forex traders identify prevailing trends and confirm trading signals.
Facts
Bollinger Bands® is a registered trademark of Bollinger, John A.
The trademark is registered for "Financial analysis and research services".
Registration date: 12/20/2011
Copyright © Forex-indicators.net
Comments
 Indicators:


you should also explain to your readers the concept of of bollinger band ' bands' = 20 / 2 + 20 / 1 which forms a trend channel and is clearer to monitor
Excellent advice, thank you!
I'll add some examples and descriptions with time.
I never knew bollinger bands had so much to tell. Thak you.
Pettre.
for intraday use 12-2.0 bollinger
Great Job, but could you put a file link for us to free download these indicators int our MT4, to work on them live trading.
BB's already come with the Metatrader.
i like this amazing description
Let's continue about Bollinger Bands.
Another well known approach is to use 2 sets of Bollinger bands:
Bollinger bands (20, 2) and Bollinger bands (20, 1) together on one chart.
What it does, it creates a set of channels, the borders of which can be effectively used to gauge the strength of a trend.
Namely:
- When the market trades inside the BB (20, 1), this suggests a weak trend, an absence of a trend or a change of a trend.
- When, the market trades outside the BB (20, 1), this suggest a stronger move and evidence of a trend.
- When the price moves outside the BB (20, 2), this suggest an extra acceleration of the move, which will soon create a reversal or at least a pause - thus, it's the right time to cash in at the top/bottom.
Let's look at the next example, where different trend conditions are highlighted in colors:
1. Red patch - a strong downtrend is clearly visible in the red highlighted area as price moves in between the bands (20, 1) and (20, 2).
2. Yellow patch - price returns back inside the BB (20, 1) - no trend.
3. Green patch - a strong uptrend, followed by a tall bullish candle - an acceleration of a trend, which soon pauses - price retraces back inside the BB (20, 1).
Great job. Thanx for discription. keep it up. god bless u.
Thank u keep it up
ty
AMAZING!!!!
GOOD JOB.
AZWAN AZIZ,MALAYSIA
how i could interpret heiken ashi could u tell me about its detail please
You'll be able to find it here:
Heiken ashi candlesticks
I had seen several strategies and explanations before but, until reading your explanation the light never came on about how useful Bollinger Bands are. Thank you very much!!!
Hey, you were talking about using 2 sets of Bollinger bands, how do you turn on the second set in your metatrader?
First you place Bollinger band (20, 2), then you place another Bollinger band, but change the settings to (20, 1) - you'll get 2 sets, if that's what you mean.
P.S. if you don't see the second indicator, try clicking on the Bollinger bands on your chart (right click) and change the settings to 20, 1... if that's where you stuck, otherwise, please provide more details.
How do i get ride of the middle line? Thanks.
To get rid of the middle line in Bollinger Bands (20, 2), place SMA with the same period (SMA 20 in this case) on your chart, then change the color of the SMA to match the color of your chart background.
how can we use Bolinger Band for minute 15 and minute 30. what i really mean is for short trade (less than one or 2 hours)
BB can be successfully used on all time frames.
good explaination! tq
This is great stuff thank you
I noticed in the two bolinger band was shown in 1hr time frame can they be used in dailey chart
Yes, without a doubt.
Post new comment