May I please ask about trend lines. Are they also belong to trend indicators. If yes, why you don't mention it here.
FxIndicators
Trend lines are not exactly indicators, but rather technical tools. Trend lines are graphical analytical tools, applied by traders without any mathematical formula behind them.
However, you'll be right naming trend lines as indicators if we start speaking about automated trading systems, where even trend lines are drawn by a software.
Hello,
I just get to kow about your website now and found it very useful for beginners...
Kudos to you for a good job...
Please i need your help, i want you to please give me some free eBooks that explained better about Trend Indicators, and the ones that explained better Oscillators.
I will be very happy if you can help me with it.
Help me send it to jidomis(at)yahoo.com
Jyde... Becoming your FX apprentice.
FxIndicators
I don't have any particular e-books on these subjects, unfortunately. I'm sorry.
I think browsing through the maze of Forex websites can bring some results.
4leafclover
I'd like to know if there is an indicator out, so that it may count bars from a low or high point and project out from that low or high eg. 30 60 90 bars and so on. I'd like to be able to pick a number of these highs and lows and start counts from them. So that I may see if a cluster appears eg. 90bars 180bars 360bars 1440bars coming together from various highs and lows at some future point. This is a Gann tech , if anyone can help thanks.
Regards 4leafclover
FxIndicators
I haven't come across such indicator yet.
trader
thxxxxxxxxxxxxxxxxxxxx
Davids
hello,
thank you for all your help on this forum, I appreciate you immensely. can you please tell me which you'd prefer OsMA or MACD as a trend indicator. Thanks Davids
FxIndicators
It won't be right to give reference to any indicator in this case. It'll depend on many variables, such as time frame, currency pair, other indicators you already use for analysis, the type of trading you look to do etc. In some cases it'll be one indicator, in others - another.
trader
I am a new guy. I dont know how to place a pending trade. Pls can any one help?
FxIndicators
Pending trades aren't really the subject of our discussion, but.. in order to place a pending order on may platforms you need to Right click anywhere on the price chart and from the pop-up menu select:
"Buy Stop" (to place a pending Buy order above the current price)
"Sell Limit" (to place a pending Sell order above the current price)
"Buy Limit" (to place a pending Buy order below the current price)
"Sell Stop" (to place a pending Sell order below the current price)
If you can't find those types of orders anywhere on your platform, don't be hesitant about asking your broker to help you find it, they'll be glad to show you.
trader
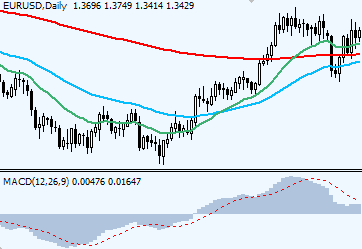
Hello.. On this very page, there's an image of moving averages and they seem to be good..coz i notice that when in a sell position, the lower MA acts as a resisatance and when in buy, the top most MA could give one an option for taking profits?
Could you please tell me what parameters you used?? Thanks.
FxIndicators
20, 50 and 200 SMA.
trader
hello im using 2moving average but which inditor can i combine to it to confirm the trend thanks
trader
good job
trader
absolutelly thks
trader
would you telling me which trend indicators that having highest accuracy in time frame 5 0r 15, and with the best parameter setting - absolutelly thks before
trader
how to understand the trends for EUROUSD
trader
Pls could you review FX SNIPER indicator ? Thanks for your great job.
 Indicators:


May I please ask about trend lines. Are they also belong to trend indicators. If yes, why you don't mention it here.
Trend lines are not exactly indicators, but rather technical tools. Trend lines are graphical analytical tools, applied by traders without any mathematical formula behind them.
However, you'll be right naming trend lines as indicators if we start speaking about automated trading systems, where even trend lines are drawn by a software.
Here we've covered Forex trend lines.
Hello,
I just get to kow about your website now and found it very useful for beginners...
Kudos to you for a good job...
Please i need your help, i want you to please give me some free eBooks that explained better about Trend Indicators, and the ones that explained better Oscillators.
I will be very happy if you can help me with it.
Help me send it to jidomis(at)yahoo.com
Jyde... Becoming your FX apprentice.
I don't have any particular e-books on these subjects, unfortunately. I'm sorry.
I think browsing through the maze of Forex websites can bring some results.
I'd like to know if there is an indicator out, so that it may count bars from a low or high point and project out from that low or high eg. 30 60 90 bars and so on. I'd like to be able to pick a number of these highs and lows and start counts from them. So that I may see if a cluster appears eg. 90bars 180bars 360bars 1440bars coming together from various highs and lows at some future point. This is a Gann tech , if anyone can help thanks.
Regards 4leafclover
I haven't come across such indicator yet.
thxxxxxxxxxxxxxxxxxxxx
hello,
thank you for all your help on this forum, I appreciate you immensely. can you please tell me which you'd prefer OsMA or MACD as a trend indicator. Thanks Davids
It won't be right to give reference to any indicator in this case. It'll depend on many variables, such as time frame, currency pair, other indicators you already use for analysis, the type of trading you look to do etc. In some cases it'll be one indicator, in others - another.
I am a new guy. I dont know how to place a pending trade. Pls can any one help?
Pending trades aren't really the subject of our discussion, but.. in order to place a pending order on may platforms you need to Right click anywhere on the price chart and from the pop-up menu select:
"Buy Stop" (to place a pending Buy order above the current price)
"Sell Limit" (to place a pending Sell order above the current price)
"Buy Limit" (to place a pending Buy order below the current price)
"Sell Stop" (to place a pending Sell order below the current price)
If you can't find those types of orders anywhere on your platform, don't be hesitant about asking your broker to help you find it, they'll be glad to show you.
Hello.. On this very page, there's an image of moving averages and they seem to be good..coz i notice that when in a sell position, the lower MA acts as a resisatance and when in buy, the top most MA could give one an option for taking profits?
Could you please tell me what parameters you used?? Thanks.
20, 50 and 200 SMA.
hello im using 2moving average but which inditor can i combine to it to confirm the trend thanks
good job
absolutelly thks
would you telling me which trend indicators that having highest accuracy in time frame 5 0r 15, and with the best parameter setting - absolutelly thks before
how to understand the trends for EUROUSD
Pls could you review FX SNIPER indicator ? Thanks for your great job.
Post new comment