 Indicators:
 |

|
|
|


|
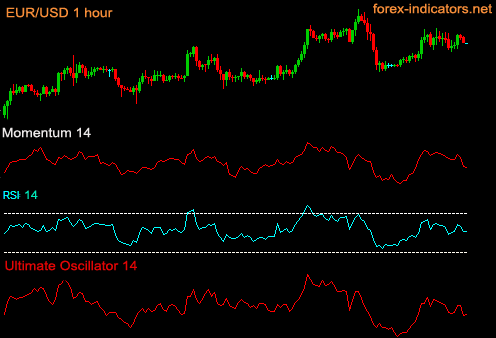
How to Choose the Best Combination of Forex IndicatorsThe goal is to pick the best indicators set. When two or more indicators provide identical information about prices, it hardly ever helps trading better; and while Forex traders call it "signal confirmation", it is in reality could be the same type of data, and should be called "duplication", rather than "confirmation". When money is at stake, the problem becomes serious… If you are randomly choosing indicators for technical analysis, chances are you’ll pick some with similar studies. How to avoid this? First of all traders should know what type of indicator they use. There are general categories of indicators: - Trend indicators Traders should avoid using too many indicators from the same category. There is also a simple method of identifying similar indicators. By setting up chosen indicators on a chart, you will be able to basically see a similar pattern of indicators behavior. If they rise and fall in almost similar intervals, they are most likely identical in the type of data they provide. Here is an example of indicators showing similar data:
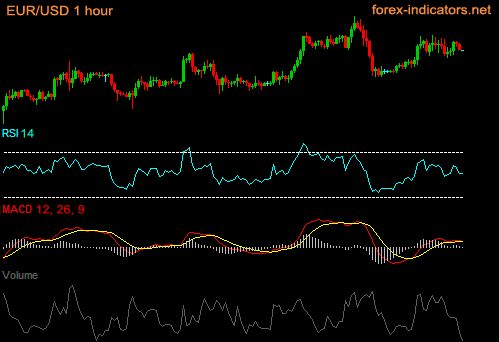
Note that Momentum indicator, RSI and Ultimate Oscillator: all behave in a distinctive similar pattern. For quality signals you would need to choose only one of them and exclude others. Here is an example of indicators providing different type of data:
RSI is a momentum indicator, MACD – trend indicator and Volume belongs to Volume indicators. Each of them represent price from different angles, providing a complex study of the market. These simple rules of choosing the best set of indicators are used by experienced Forex traders for quality market research and trading. Copyright © Forex-indicators.net Comments |

Hi, I'm just newbie and have some questions here:
1. should I choose one of each indicator kind to get good prediction result? Or just 2 or three of them will be enough?
2. what is the best combination you suggest?
thanks,
Heri, Indonesia
Hi Heri,
We all have our own favorite indicators we like to trade with. It could be 2 Forex indicators, could be 4 or more. The key goal is to check them against the group they belong to and make sure you're not using indicators that tell the "same story".
Regarding the number of indicators to use at once, I'd suggest using no more than 3 at the time (excluding Moving averages, because often traders would use several moving averages for trend identification purposes).
What are the best indicators to use: start with moving averages: add 200 EMA, 20 SMA, definitely add Stochastic indicator. Then at your choice opt for MACD, ADX or Bollinger bands. Everything else is a matter of own preferences and education on Forex trading you're going to get.
What combination of indicators do you suggest to be able to determine when a currency pair has gone from a trending condition to a ranging condition and vice versa? Being able to tell when these conditions change at the earliest possible time would be extremely useful.
Adx is useful but it lags way too much to be of any use on the shorter timeframes.
Thank you.
Bollinger bands are useful for determining changing trends. Squeezing BB means a trend is pausing.
Still, Bollinger bands are far too late to tell about the beginning of a sideways price movement.
Indicators cannot predict sideways patterns in advance, because indicators only reflect the market as it behaves. In order to start ranging, market should first fail to make Higher high (in an uptrend) or Lower Low (in a downtrend). From this "point of failure" traders can anticipate the beginning of price sideways shifts.
Once the failure point is identified, use trend lines to highlight a sideways channel by drawing horisontal support/resistance lines as shown on the image below.
If to return to indicators solution, try MACD 12, 26, 9, where draw two horisontal lines at 25 and -25 level and consider it to be a ranging market when MACD stays in between the levels as shown on the screenshot below:
pls i have been using my indicators with the combination of technical analysis from action forex, but most times the trade goes agaist the pivot inference, what do you advice abt pivot analysis
brown frm Naija
Pivot points are fist of all levels of strong Support and Resistance.
You can trade by signals from any indicators, but each time price approaches any of the Pivot levels, be sure to keep an eye on its reaction, but better off, take your profits out of the market at the Pivot Point or R1, R2, S1, S2 etc levels and wait for the next opportunity to trade with the signals received from your indicators.
Use areas around Pivot points for setting stops, trailing or tightening stops, taking profits or scaling out of the market. As soon as price moves away from Pivot lines, turn to your indicators for a signal to enter a trade again.
which indicators can i conbine to get real result on when to quit and enter the market.
Emeka from Naija
pls throw more light on how Bollinger band works,ADX,RSI,MACD
I try to play the video series on your site, but i keep on having buffering what is the solution to this? Ade(Nija)
I've added more info about Bollinger bands and other indicators.
As to combination of tools, here are the favorites to try: best MT4 indicators
Video files are also accessible via Youtube. Just try another time, it should work fine, otherwise please provide a link to the page with a broken video. Thank you.
Very Educational.. Thanks. :P
Hello,
I am considering trading on daily charts. For this purpose i am planning to use Stochastics Oscillator(default settings) for entry signals and ADX(default settings) for trend confirmation. Is it correct to use these indicator for the above purpose? If not can you suggest any alternative?
Your inputs much appreciated
Thanking you
Musshan
Yes, it'll work. Stochastic is ideal for timing trades and catching the right momentum with divergence and extreme levels of oversold/overbought; while ADX should guide whether there are any trends to trade.
I'd recommend studying Stochastic divergence, you can also compare it to MACD divergence - both are powerful tools to anticipate market reversal and continuation patterns.
hi there, i'm currently using the following indicators:
1. MACD
2. stochastic
3. rsi
4. adx
5. parabolic sars, and
6. moving average..
Does those indicators listed above "duplicate" with each others?. Appreciate your wise opinion on this matter. By the way, thanks for sharing a lotta info in this informative site.. :)
yes, some will duplicate data.
RSI and Stochastic, MACD and SAR, also MACD and Moving averages if you use the same Moving average as in MACD.
please sir i have a little question to ask. if i am using 4 indicators from different categories, i believe that before you place a trade in forex, most or all your indicators must agree but what do i do in a situation where the 4 indicators from different categories are giving me different behaviour about the market, because in this case it will be difficult to decide the indicator to go for at that point in time.
You don't necessarily have to use many indicators.
The more indicators you use, the harder it'll be to find periods when all indicators agree on a signal.
If your current indicators contradict each other too often and don't allow you to make trades in weeks, while you notice that you're continuously missing perfect trading opportunities and trends, you have to change something. Otherwise, listen to what they say, they are probably keeping you out of trouble.
sir please tell me that how to pick the bolinger low band crossover of price with the help of moving average
I'm not sure I know how it should be done. I haven't seen setups where Bollinger bands were use in combination with Moving averages. The middle line of the Bollinger band indicator is a Simple moving average by itself, other than that, I'd need you to give me some more details, please.
I am reading the site and seems very informative for me as a learner.
Please keep up the good work and add more contents with the indicators.
Thanks :)
Thank you, I'm glad you like it!
please tell me what type of CCI is that??Trend or volume or momentum or volatilty?
Yours: Lalsangliana
It's momentum.
Hi FI, can you please update your site with "Cycle indicators". I have no idea of what are those indicators. Also please name some of the Cycle indicators.
Thanks
Thank you.
We'll do so shortly.
Post new comment