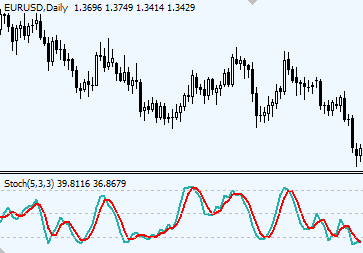
Simply put, K% line stays hangs at the back (or, we can say, stays to the left on your screen), while D% line moves in the front (stays to the right).
The 80 and 20 lines are drawn using Indicator Properties settings. If you use Mt4, then you should use Indicators properties, tab called "Levels", where you can add/remove any levels you need.
If you use other platforms, there also should be ways to add those levels. Ask you broker.
Or you can also add those 80 and 20 lines manually by using a trend line tool.
trader
I'm surprised that nobody picked up the fact that the formulas for full and slow stochastic are the same. The only thing that changed is the name of the variables. They produce the same chart.
Eli
Hi,
I have a question, there are three types of stochastic Full,Fast and Slow with three parameters each,i use stochastic with only ONE parameter,my system based on him but i still cannot figure out what kind stochastic is it,i tried everything.
thanks
Eli
FxIndicators
Full and Slow Stochastic are the same.
Eli, the default Stochastic is usually a Slow one.
So, that's going to be Slow Stochastic (5, 3) or Slow Stochastic (14, 3), whichever period is set a default for the Slow Stochastic on your platform.
Ade
hi can someone explain to me if the stochastic is 100-80 we should not make any trade. Ade
FxIndicators
Stochastic at 100-80 means that there is an uptrend in progress. The market is considered overbought, which means that if you wanted to be in that uptrend move you should have entered earlier.
When price is trending well, Stochastic may easily remain in overbought zone (above 80) for a long period of time while crossing there multiple times. But during other times you'll see price reversing shortly after Stochastic has entered an overbought zone.
Thus, if you see that the market rallies, ignore Stochastic signals above 80 and open a Long position, in all other cases, don't open new trades when Stochastic is already above 80.
Franta Hulvat
Hi again,
on this video above, is Stochastic oscilator, and two another lines - green and red, indicating main trend.
Do You know, what is this two lines??
Many thanx for Your help.
Excuse my bad English pleas.
Best regards, Franta Hulvat
FxIndicators
These are the lines of the daily Stochastic placed above the 1 hour chart and its hourly Stochastic.
On your platform you'll simply need to have two charts open to see the same picture.
trader
Hi,
I like this teaching on stochastic....so informative.
trader
Really very very informative
trader
Hello,
Which one is the signal line? the green line or the red line?
FxIndicators
The red.
By default it can also appear as the dashed line.
trader
THANKS. IT WAS NICELY EXPLAINED. GREAT JOB
trader
Thanks and best luck to you ")
trader
very nice explained
trader
Hello,
It was a great explanation. What the the suitable stochastic signal for hourly & daily trade? I am using (8,3,3) right now? Thank you
trader
Hi,
Very nice site. The best explanations for indicators.
Could you suggest me intra-day indicators.
odoze
i am odoze, i just got some indicators named, FXI CARMEL BACK, FXI MOVING AVERAGE, FXI DIVERGENCE SCAN,FXI FRACTAL, FXI MOMENTUM VALUE, FXI FRACTALS, FXI DAY LINES AND FXI PRICE ALERT, pls i want someone to teach me how to use them
trader
Very Nicely presented !!! Keep It Up
Thanks Too
Ali
Hi, very well explained thank you very much. My question is , how will I trade if the D and the K lines crossover remains between the 20 and the 80 lines. Thanks Ali
trader
In the chart in the middle of the presentation, you are referring to weekly, daily and hourly chart periods. Is the pair of Long slow Stochastic line that only goes through 1 or 2 oscillations a weekly Stochastic and the much more active oscillator that is constantly going through the 20% & 80% levels an hourly Stochastic, Daily or Weekly Stochastic or ???
Again, you speak of utilizing different time frames. But if one is using an hourly chart, how does one get it to show a Daily or weekly Stochastic on the same chart at the SAME TIME to compare these as your example chart does?
trader
.God bless u richly for this site,but please i am a new trader.but please i need detailed explanation on how to use double stochastics. [email protected]. Thankyou in advance
Sam
Firstly Great site... thank you for the information!. I have one question - What do you recommend as the best time interval to set in these graphs?. I like to trade a few trades every 15-20mins or so.
Thanks!
Sam
trader
i am intrested in fxspot trading with 5min chart can i use this indicator on 5min
 Indicators:


Hi Cindy,
Simply put, K% line stays hangs at the back (or, we can say, stays to the left on your screen), while D% line moves in the front (stays to the right).
The 80 and 20 lines are drawn using Indicator Properties settings. If you use Mt4, then you should use Indicators properties, tab called "Levels", where you can add/remove any levels you need.
If you use other platforms, there also should be ways to add those levels. Ask you broker.
Or you can also add those 80 and 20 lines manually by using a trend line tool.
I'm surprised that nobody picked up the fact that the formulas for full and slow stochastic are the same. The only thing that changed is the name of the variables. They produce the same chart.
Hi,
I have a question, there are three types of stochastic Full,Fast and Slow with three parameters each,i use stochastic with only ONE parameter,my system based on him but i still cannot figure out what kind stochastic is it,i tried everything.
thanks
Eli
Full and Slow Stochastic are the same.
Eli, the default Stochastic is usually a Slow one.
So, that's going to be Slow Stochastic (5, 3) or Slow Stochastic (14, 3), whichever period is set a default for the Slow Stochastic on your platform.
hi can someone explain to me if the stochastic is 100-80 we should not make any trade. Ade
Stochastic at 100-80 means that there is an uptrend in progress. The market is considered overbought, which means that if you wanted to be in that uptrend move you should have entered earlier.
When price is trending well, Stochastic may easily remain in overbought zone (above 80) for a long period of time while crossing there multiple times. But during other times you'll see price reversing shortly after Stochastic has entered an overbought zone.
Thus, if you see that the market rallies, ignore Stochastic signals above 80 and open a Long position, in all other cases, don't open new trades when Stochastic is already above 80.
Hi again,
on this video above, is Stochastic oscilator, and two another lines - green and red, indicating main trend.
Do You know, what is this two lines??
Many thanx for Your help.
Excuse my bad English pleas.
Best regards, Franta Hulvat
These are the lines of the daily Stochastic placed above the 1 hour chart and its hourly Stochastic.
On your platform you'll simply need to have two charts open to see the same picture.
Hi,
I like this teaching on stochastic....so informative.
Really very very informative
Hello,
Which one is the signal line? the green line or the red line?
The red.
By default it can also appear as the dashed line.
THANKS. IT WAS NICELY EXPLAINED. GREAT JOB
Thanks and best luck to you ")
very nice explained
Hello,
It was a great explanation. What the the suitable stochastic signal for hourly & daily trade? I am using (8,3,3) right now? Thank you
Hi,
Very nice site. The best explanations for indicators.
Could you suggest me intra-day indicators.
i am odoze, i just got some indicators named, FXI CARMEL BACK, FXI MOVING AVERAGE, FXI DIVERGENCE SCAN,FXI FRACTAL, FXI MOMENTUM VALUE, FXI FRACTALS, FXI DAY LINES AND FXI PRICE ALERT, pls i want someone to teach me how to use them
Very Nicely presented !!! Keep It Up
Thanks Too
Hi, very well explained thank you very much. My question is , how will I trade if the D and the K lines crossover remains between the 20 and the 80 lines. Thanks Ali
In the chart in the middle of the presentation, you are referring to weekly, daily and hourly chart periods. Is the pair of Long slow Stochastic line that only goes through 1 or 2 oscillations a weekly Stochastic and the much more active oscillator that is constantly going through the 20% & 80% levels an hourly Stochastic, Daily or Weekly Stochastic or ???
Again, you speak of utilizing different time frames. But if one is using an hourly chart, how does one get it to show a Daily or weekly Stochastic on the same chart at the SAME TIME to compare these as your example chart does?
.God bless u richly for this site,but please i am a new trader.but please i need detailed explanation on how to use double stochastics. [email protected]. Thankyou in advance
Firstly Great site... thank you for the information!. I have one question - What do you recommend as the best time interval to set in these graphs?. I like to trade a few trades every 15-20mins or so.
Thanks!
Sam
i am intrested in fxspot trading with 5min chart can i use this indicator on 5min
Thanks , for giving valuable information...[email protected]
Post new comment