|
 |

|
Aroon Indicator
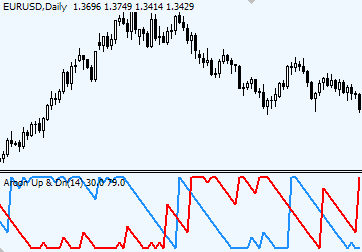
Aroon Quick SummaryTrading with Aroon indicator involves the following signals: Aroon IndicatorThe idea behind Aroon indicator Aroon indicator is a young one, developed by Tushar Chande in 1995. How to interpret Aroon indicatorThere are two parts to the Aroon Indicator – two coloured lines: Aroon up (red line) and Aroon down (blue line). There are 4 important levels to monitor when trading with Aroon indicator: 0, 30, 70 and 100. The default time period for Aroon indicator is 25, on some panels - 14. But, it can be changed to, for example, 10-periods for shorter term trades or to 50-periods for longer ones. Aroon Forex chart example
How to trade using Aroon indicator?1. When AroonUp crosses AroonDown upwards it is a bullish signal. AroonUp rules: 1. When AroonUp reaches the 100 level the uptrend is clearly strong; the closer it remains to the top the stronger the uptrend. Opposite true for AroonDown: 1. When AroonDown reaches the 100 level it suggests downtrend being strong; the closer it remains to the top the stronger the downtrend. Aroon FormulaAroon(up) = ((total number of periods — number of periods since highest close) / total number of periods) x 100 Aroon(down) = ((total number of periods — number of periods since lowest close) / total number of periods)) x 100 Aroon indicator shows how much time passed between the highest (up) or lowest (down) close since the beginning of a period (in percents). ConclusionAs market changes, traders adjust their trading approaches and methods from trend following to tools used during market consolidations. Aroon indicator helps traders to determine when to use a trend following indicators and tools and where to switch to oscillator like tools that work best in consolidating markets. Comments |
YAA ITS REALLY HELP I USE IT WITH STOCHASTIC IT GIVE ME GOOD RESULTS
JATIN
One of the major problems of the aroon indicators is the arbitrary time period.
If you vary the period, from say 25 to 15 days, you get a second diagram that appears to be, essentially, offset from the first, therefore giving completely different signals!
If you vary the period to fit the past data (!), there's no assurance that it will fit future data.
coooooooooooooooooooooool
There is no "holy grail" when it comes to indicators. The best thing is to use multiple indicators for confirmation. It is also important to understand the formula used to calculate each indicator, to avoid using linear variations of the same algorithm which, of course, would yield the same result instead of valid confirmation.
pls how can i download this indicator?
can u provide the mq4 file for this indicator for download?
Just added above.
Download: Aroon_Up_Down.mq4
I think it's kool!
thanks a lot
Very Cool indicator !! THANK YOU SO MUCH.
1 no. only arun in mkt..............
yasin
plis give us the exemple for aaron formula.......oke?
All Indicators are useful. The problem is that you should know how to use, i mean how you read the indicator you are using. I have a set up of twelve indicators. I use all at the same time one by one. The results are fine.
Thanks and good luck to all.
HS
According to the experience I've has this indicator, which I appreciate, It's very helpful to use when taking a trade position, not that much good when exit the trade.
sidabumi
How can I calculate strong up trend (1 and 5 on graph.) length? How many days or hours?
Which indicator or something else can be used for confirmation of up trend period length?
Very good indicator. Good results.
The backtest of the Aroon Indicator: http://www.oxfordstrat.com/trading-strategies/aroon-indicator-crossover/
Post new comment