 Indicators:
 |

|
|
|


|
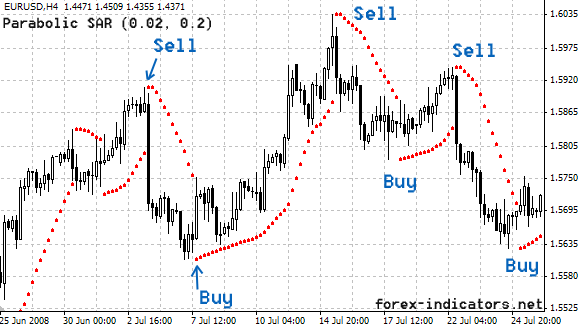
Parabolic SAR indicator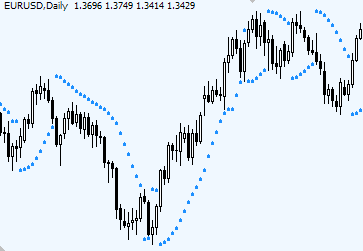 Quick SummaryTrading with Parabolic SAR involves the following signals: Parabolic SARParabolic SAR indicator is a trend indicator, which tells Forex traders about price stop-and-reverse points as well as trend direction. Its concept of usage is easy to understand from the first look. When price is above Parabolic SAR dots, Forex traders should be holding Long positions only. Once Parabolic SAR dots come on top of the price - it is time to change trading positions to Short.
How to trade with Parabolic SAR indicatorHowever, trading with Parabolic SAR is not that simple; not all Parabolic SAR reversal signals can be traded profitably. The way Forex traders use Parabolic SAR is by simply setting a Stop loss order at the level of the most recent SAR dot appearing on the chart. Stop is then trailed along with each new Sar dot till trend remains intact. Once Parabolic SAR indicator changes its position - SAR dots appear on the opposite side of the price - the trade is closed. Welles Wilder doesn't recommend using Parabolic SAR as a stand alone indicator. The main reason for that is: Parabolic SAR can easily create whip-saws (false signals) during periods of market consolidation. The Parabolic SAR works best during strong trending periods, which Wilder himself estimates occur roughly 30% of the time. Thus Forex traders will need other Forex indicators to identify those strong trending periods. How do you determine the trend if you don't want to use ADX. Try 50 EMA. Price readings above it would suggest an uptrend, below - downtrend. Parabolic SAR settingsSo, Parabolic SAR is developed to keep stop loss level moving adjusting to new prices and thus locking profits on its way. Parabolic SAR has two variables: a step and max step. Settings recommended by W.Wilder are: a step of 0.02 and the max step of 0.2. Parabolic SAR - useful tips:Tip 1: Tip 2: Parabolic SAR indicator Formula
Copyright © Forex-indicators.net |

Thank's for all
After 15 sites the best formula and example of SAR.
Good explanation.
Very good.
George Shaderov.
thanks...
clear explanation
I love your website! the best and clearest explanations of indicators anywhere on the net!!
AJ
Thank you.
that's because I TRADE with those indicators, not just TALK about them.
thanks
It help me a lot.
Thanks
THANK YOU SO MUCH IT HELP ME TO UNDERSTAND THIS STRATEGY
THANK YOU AGIN
This is the best explanation on PSAR I can found.
One issue to clear up: Is L(t) same as Low(t), H(t) same as High(t) ?
Thanks again.
yes, it's the same.
Good explanation of SAR and many other indicators, thank you.
THANK YOU SO MUCH..
very very good.
Easy to understand and useful.
Thanks.
The parabolic Sar explanation is very clear... i will give it a try.... thanks a million.
MT4 IS THE BEST
THANK YOU
very good
Really usefull information regarding PSAR, few new things which I never knew.
great example i clearly understood
can this formula be incorporated in EXCEL, if so anyone kind enough to help me out. Thanks
Sorry, the formula is complicated even for me. Anyone else?
thanks, you guys are great. you have giving me a million dollar simplest explanation i am eanarmostly grateful. Best Regards, Winston
Your website is one of the best sites for Forex Trading knowledge. Thanking you, for sharing all this information and making it clear. Cheers...
aVi
Don't stop talk about indicators... You helps us a lot.
Very good job... Thanks!!!
In 5 step there is a little mistake: we must use SAR(t-1) to calculate AFD, not SAR(t).
Sir, can you please explai the parameters for SAR on 60min and/or dlay chart for swing trading?
Post new comment