 Indicators:
 |

|
|
|


|
Relative Strength Index (RSI)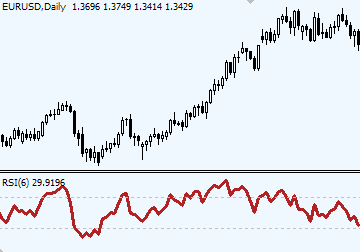
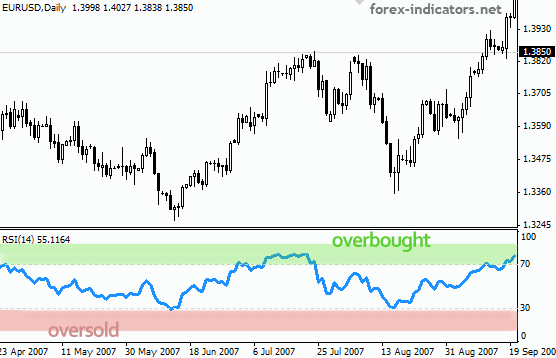
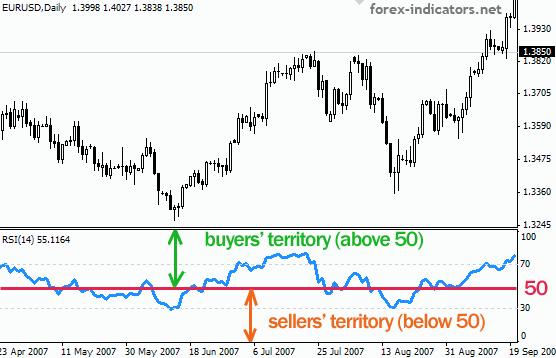
Introduction to RSI indicatorRelative Strength Index (RSI) - is another great momentum indicator developed by Welles Wilder. Standard period settings for RSI is 14 periods, which can be applied to any time frame. Quick SummaryTrading with RSI indicator involves the following signals: • RSI moving above 50 level — uptrend is confirmed, below 50 — downtrend is confirmed. • RSI peaking above 70 level — market is overbought. Let's review each of these RSI signals below. How to trade with RSI indicatorRSI indicator is often referred as an overbought/oversold indicator, however, this is not exactly accurate. RSI doesn't provide Buy/Sell signals upon reaching oversold/overbought areas, there are certain rules, which help to identify the right timing for entries and exits.
Readings above 70 indicate an overbought market, while readings below 30 indicate an oversold market. In order to enter at the right moment (on the true market reversal) Forex traders should wait for RSI to leave its overbought/oversold area. For example, when RSI goes above 70, Forex traders would prepare to Sell, but the actual trade will take place only when RSI crosses down below 70.
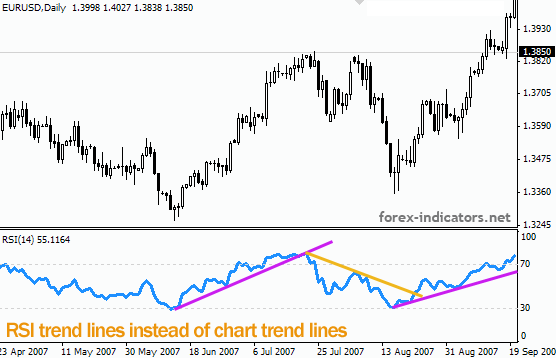
Forex traders also use 50 level of the RSI indicator, which separates buying forces from selling forces on the market. Certain trading strategies use RSI 50 level to confirm Long and Short entries by looking at a positioning of the RSI in relation to its 50 level. RSI trend linesRSI indicator has got another handy feature: Forex traders use RSI to draw trend lines.
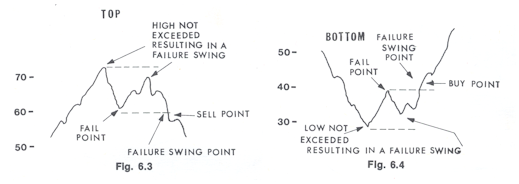
With RSI trend lines Forex traders are able to receive a much earlier warning about upcoming trend changes since RSI trend lines witness a breakout few candles earlier than chart trend lines. Trading divergence with RSI indicatorAnother way to exploit RSI is to take advantage of RSI divergence signals. The best way to learn about any indicators is to read original works of their creators. "(3) Failure Swings: Failure swings above 70 or below 30 are very strong indications of a market reversal. (See Fig. 6.3 and Fig. 6.4)"
"(5) Divergence: Although divergence does not occur at every turning point, it does occur at most significant turning points. When divergence begins to show up after a good directional move, this is a very strong indication that a turning point is near. Divergence is the single most indicative characteristic of the Relative Strength Index." RSI indicator FormulaRSI = 100 - 100 / (RS + 1) where: RS = Average Upward Price Change / Average Downward Price Change Average Upward Price Change = [(previous Average Upward Price Change) x 13 + current Upward Change] / 14 Average Downward Price Change = [(previous Average Downward Price Change) x 13 + current Downward Change] / 14 For calculation Downward Price Changes are taken as positive values. Comments |


explanation concise and helpful, thank you.
Well explained RSI!
Adding to the subject: RSI is also known to form patterns, such as wedges, triangles, double tops and bottoms, head and shoulders etc. Daily charts are perfect to watch these patterns. RSI breakouts from own patterns often happen 1-2 days earlier than price breakouts on the charts, providing an invaluable information to a trader.
Default RSI 14 can be enhanced & filtered with another shorter period RSI, for example RSI 3, RSI 6.
The advantage a longer default RSI is that it uses a longer time period and thus produces less false signals, however, it will lag more. The shorter period RSI will give the less of a lag when it comes to identifying important turning points.
Using default RSI (14) and a shorter RSI (6) in conjunction gives a certain edge in reading chart signals: signals which are not distinctive on the 14 RSI stand out more clearly on the 6 RSI chart.
At times 6 RSI will lead, but other times it'll go together with 14 RSI, which allows to distinguish stronger signals and filter out least important ones.
best rsi tutorial ive read yet.
The formula is wrong. The right one is:
RSI = 100 - 100 / (RS + 1)
Thanks a lot indeed!
It's been fixed.
thank you so much for this awsome site
Very well explained
thanx forex-indicators.net Team
very easy to understand
Hi there, should'nt they be reversed, taken from above
When RSI approaches 30 look for a bullish divergence => slowly rising RSI versus already declining prices.
When RSI approaches 70 traders watch for a bearish divergence, which occur when actual RSI readings
I don't think so.
A Bullish divergence is formed when RSI is at the bottom and begins to rise, while price keeps making new lows.
A Bearish divergence - RSI at the top starting to decline.
I have no words to thank you for your well explained lessons Thanks a lot !!
amazing stuff here....please keep up the excellent work.
excellent explanation.hope to hit the jack pot with it.more grease to you.
This is really clear and well explained. It really helped to understand better of RSI, thank you guys.
keep it up
how do i get the rsi indicator on my platform
In MT4 you'll do it from Menu: Insert, Indicators, Oscillators, Relative Strength Index.
In other platforms it'll take different steps, so just ask your broker for a help or a platform tutorial.
simple but best explaintion
its not only a formula its like a philosophy. by sarathi
if u know the rsi u definetly earn high profit.
"Using default RSI (14) and a shorter RSI (6) in conjunction gives a certain edge in reading chart signals: signals which are not distinctive on the 14 RSI stand out more clearly on the 6 RSI chart."
Brilliant! Taking your lead I am putting RSI (13) and RSI (5) in the same window box. The cross provides an excellent signal. I had given up on the RSI but, this works really slick. I have developed my strategies using more information from your site than all other sources combined. Even though I have read it all more than once I keep coming back for new inspiration and ideas I didn't think of previously. Thank you very much!
Most Excellent! I can't say enough about how well you detailed this information into the simple facts and how to use the tools of the trade. Bravo!
Absolute amazing stuff, understand it for the first time as clear as a bell and my account can proof it. Why could I not see it myself earlier on? As kid we would lie on the grass staring at the clouds, playing a game to see what object a cloud would form, to one the cloudformation would look like a house, to the other an old man, to the next a lion or a mountain. Everytime we had to explain to the others what we are seeing and then only would they also see a lion. Thank you so much, my friend.
My professor asked us a question in class that no one was able to answer.
When RSI approaches 70 and above, that's usually an indicator to sell. However, there's one scenario when the RSI reaches 70, 80, or even 90, people should buy.
His question was why would they buy if the prices increased?
Post new comment