 Indicators:
 |

|
|
|


|
Accumulative Swing Index (ASI)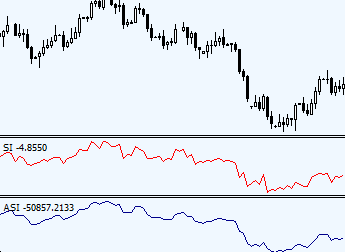
Trading with ASI indicator involves the following details: ASI has positive value — uptrend. ASI IndicatorWhat is Accumulative Swing Index Welles Wilder, the creator of ASI indicator said, "Somewhere amidst the maze of Open, High, Low and Close prices is a phantom line that is the real market." The Accumulation Swing Index shows this phantom line - the line of the real market. The Accumulative Swing Index uses a scale from 0 to 100 for an up trend and 0 to -100 for a down trend. How to interpret ASI indicatorIf a long-term trend is up, the ASI has a positive value; and if long-term trend is down indicator appears in a negative value. During sideways moving market, the ASI moves between + and - values. Trend lines are drawn on both: a chart and indicator’s graph and then compared against each other to confirm/dismiss trend line breakout signals. How to trade with Accumulative Swing IndexWelles Wilder, developer of Accumulative Swing Index indicator, describes in his book "New Concepts in Technical Trading Systems" why ASI can be used for trend line breakout confirmations. He said, that ASI is able to show the real strength and direction of the market and since Accumulative Swing Index is heavily weighted in favor of the close price, daily upward and downward spikes do not adversely affect ASI. Here is a quote from his book: "When the Index is plotted on the same chart as the daily bar chart, trend lines drawn on the ASI can be compared to trend lines drawn on the bar chart. For those who know how to draw meaningful trend lines, the ASI can be a good tool to confirm trend-line breakouts. Often erroneous breaking of trend lines drawn on bar charts will not be confirmed by the trend lines drawn on the ASI. Since the ASI is heavily weighted in favor of the close price, a quick run up or down during a day's trading does not adversely affect the index." Signal Buy with ASI occurs when indicator exceeds its previous Swing High. Accumulative Swing Index chart example
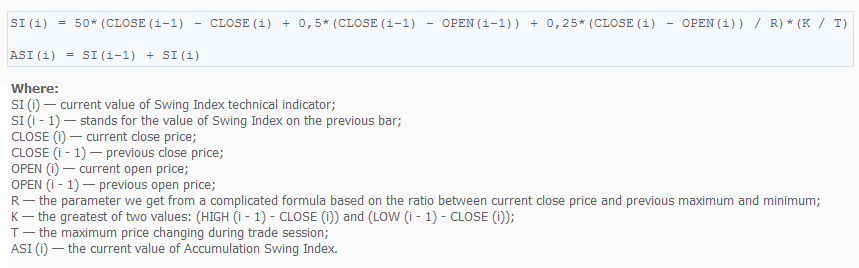
Since ASI line represents real market price, Forex traders may effectively use classic technical analysis methods on the indicator itself: Accumulative Swing Index indicator formula
Where: Accumulative Swing Index indicator - same formula (with details)
Copyright © Forex-indicators.net Comments |

 Download indicator:
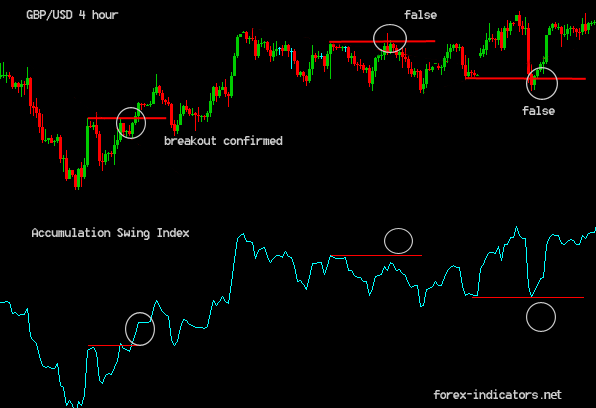
I use trade station and have to have have data inputs. What do you suggest since there are no inputs listed on the charts for reference.
Yes, there are no inputs for this indicator settings, therefore you may use whatever trading station gives you - predefined settings.
how can i download this indicator???
Download here: ASI.mq4
Hi,this isn't between -100 to +100. why?
yes, I know, but that's the only one I have for MT4 so far.
i hv downloaded tht ASI.mq4 but how i can run that prog!!!!!!!!!!!
Does this help: http://forex-indicators.net/how-to-install-mt4-indicators
or the probelem is in the code itself?
What a fantastic indicator and this is the only place I have found it! This creates a pattern similar to the Williams A/D but, is slightly less erratic. I use this for a filter (not a trigger). I place an 8 ema of the ASI in the same window. An ASI is above the EMA that confirms a buy (triggered by a couple of of other indies). An ASI is below the EMA confirms a sell. Again, thank you very much. Great site!
This can be used in 15,30 and 1 hour timeframe?
Can this to be used with a combination of trendlines too?
Trend line - absolutely.
Smaller time frames - yes.
hello sir
thanks for the information about ASI.
What differences between ASI and SI?
ASI is an Accumulative Swing Index
SI is a [Non-Accumulative] Swing Index
very excellent site to learn forex trading. may i request you to kindly add accumulation distribution indicator to your list and explain it in detail. sometimes accumulation distribution works but sometimes not.
ASI and SI give the same information and signals?
there is nothing new in this indicator,
after examining it a bit closer
I found it is following the RSI to the letter.
so ASI is basically RSI
you guys might aswell using the RSI
it will give you exactly the same result.
and you don't have to waiste your time installing this one.
Cheers
It is said that the Accumulative Swing Index uses a scale from 0 to 100 for an up trend and 0 to -100 for a down trend. But when plotted on the chart it shows -25079.3 to 25613.3. Why anybody knows? And how to interpret the readings?
The SI.mq4 cannot be displaced in most mt4 platform, I try several mt4 brokers to place this indicators, i do not know why majority of brokers' mt4 platform cannot displace this indicators, only very few broker's mt4 platform can show, why? is there any bug in this SI.mq4 file? thanks for suggestion or how to fix it.
about the SI.mq4 question just post, I do not think it is related to the having suffix or not of the fx pairs name of some brokers.
sorry sirs, previous ask SI.mq4 problem cannot displaced on mt4, now solved, it is due to memory issue, it seems it consume lots of memory, need release memory to let it show in mt4. thanks. (no need to show this and previous comments) thanks.
"there is nothing new in this indicator,
after examining it a bit closer
I found it is following the RSI to the letter.
so ASI is basically RSI
you guys might aswell using the RSI
it will give you exactly the same result.
and you don't have to waiste your time installing this one.
Cheers"
Does it?
What setting? 14? 7? 28?
Overlay the rsi onto the asi and see that it doesn't even come anywhere near close to it.
Dude uncheck min 0 and max 100 levels and it will show the same line like ASI
Post new comment