 Indicators:
 |

|
|
|


|
Volume indicator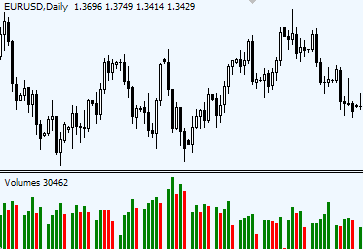
Volume - Quick SummaryTrading with Volume indicator offers the following features: A rising volume indicates rising interest among traders, while a falling volume suggests decline in interest. Extreme Volume readings — Climax Volume often highlight price reversals. Points where market trades on high volume are the points of strong support and resistance. All various kinds of breakouts and market spikes can be validated or voided with a help of Volume indicator Volume indicatorWhy Volume? Volume is the second most valuable data after the price itself. Volume and TrendVolume helps to learn about the health of a trend. When price is going up and volume is decreasing, it tells traders that a trend is unlikely to continue. Price may still attempt to increase at a slower pace, but once sellers get the grip on it (which will be signified by an increase in volume on a down candle), the price will fall. A downtrend is strong and healthy if volume increases as price moves lower and decreases when it begins retracing upwards. Volume and ReversalsTo understand the nature of spike in volume before a trend reversal, traders need to know how the data for volume indicator is gathered in Forex. When volume rises, it means lots of participants are actively selling and buying currencies. When volume spikes at certain price level, traders know that there was lots of interest shown by traders to that price level. If there is a lot of interest, it means the level is an important one. Where Volume spikes are distinctively extreme (larger than any historical spikes around) — Climax Volume — traders should look for clues from the price itself. Candles that have a narrow range, spinning tops/bottoms, dojies, stars, other candles with extremely large tails have highest chances to become the price turning points. Single volume spikes only bring price to a halt. A lot of stand-alone average volume spikes occur during fundamental economic announcements on daily basis. News can cause spike in volume for a single day and then volume disappears again. Reversals, however, happen not over one day but a series of days. If higher than average volume stays on the market for several to many days a huge volume spike — volume climax — will crown a point of market reversal.
Volume and BreakoutsVolume indicator helps to validate all kinds of breakouts. Breakout occurring on rising volume is a valid breakout, while a breakout that caused no interest from traders as it is happening on a low volume is more likely a false one. Trend lines and other breakouts are validated or voided the same way. Reading Volume Indicator step by step
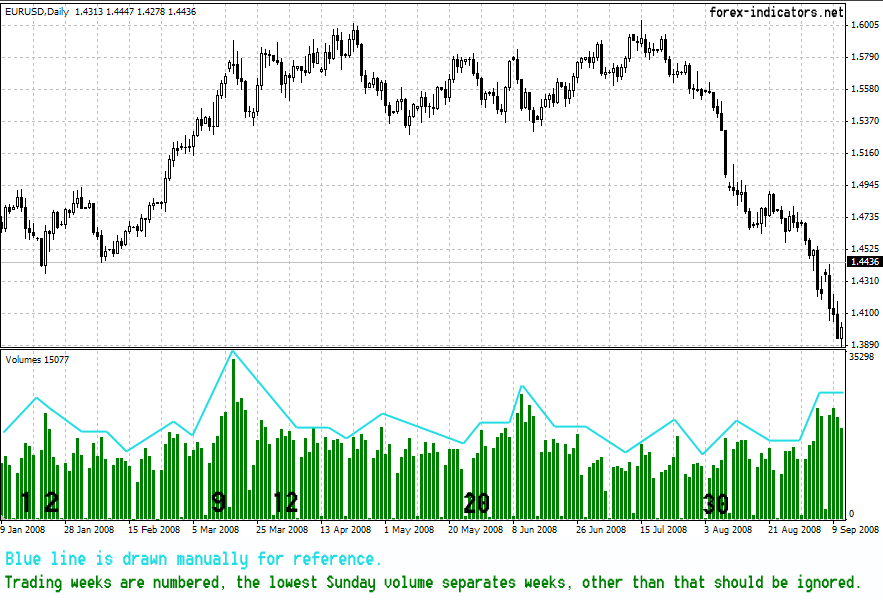
We’ll compare the weeks, not individual days. Week 1: as price falls, volume rises compare to previous week – interest to downtrend among traders grow. Week 2: volume peaks and begins to decrease as price move higher – sellers are still interested in downtrend, buying the currency is going on a lower volume. 3: volume is lower than previous weak, confirming that there is still very little interest in buying the pair. 4: Sellers push down, but this time volume doesn’t increase – it is about equal to week 3. 5: Both sides lost interest as the market drifts sideways on low trading range. 6: market finally finds dome buying interest as the week ends on higher than previous week volume. Buyers seem to be going active. 7: Buyers going full steam – volume rises – it is a healthy uptrend. 8: Correction came – volume drops, no one is interested in Selling the pair – confirmation of a healthy volume. 9: Volume picks up again once price finds its uptrend. 10: Exhaustion gap is seen on the chart, followed by a doji candle with a spike in volume – a highlight of a market turning point. Market ends trading on a lower volume. 11: Even Sunday was busier than usual. The new week market begins with an attempt to rise higher, however volume suggests that the interest to the upper side is much lower. 12, 13 and 14: market attempts to move upward, but volume decreases, signaling that the trend is no longer healthy and a change is coming soon. 15 and 16: some interest arises among traders as the market moves to the downside, Sellers anticipate that this is a moment of a trend change, a volume of new Short orders come. 17, 18 and 19: as the market attempts to rise, volume drops, telling that there is no interest to the upside. 20, 21 and 22: volume picks up again as Sellers take over. A pause on week 21 with a sharp rise in price is met by even higher volume on week 22. 23, 24, 25, and 26: market rises, volume drops – confirmation that remaining traders lose interest in that upward move. 27 and 28: Price begins to decline, volume picks up – interest to the downside is present. 29, mid 30: sideways pattern pause the trend and the volume with it. 30, 31 and so on – trend picks up making new lows, volume confirms healthy trend by rising when price is falling and pausing or falling when price is moving sideways or going into correction.
Comments |

 Download:
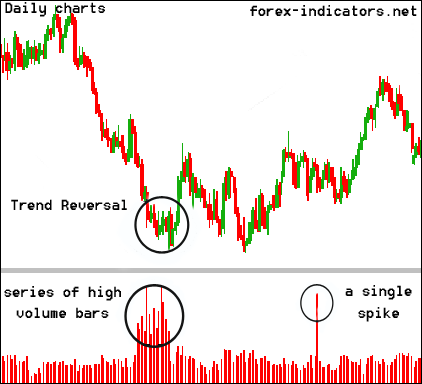
very good
50 MA helps to identify volume spikes and climax volume.
A single day volume spike on a low or average volume is considered high when volume bar exceeds 50 MA of volume 3 times.
When high volume stretches over several days span, then volume must 2 times exceed 50 MA for 2 days in a row.
Can you show an indicator which indicates orders placed v/s orders executed. ?
I don't know about such indicator in Forex.
good
In theory I understand how volume can/should be used but have never found an indicator that can determine volume for Forex. How does this indicator determine volume?
Does it require a specific data provider?
Can Forex Volume really be determined from a single bank(data source)?
It is impossible to measure the exact volume in Forex, since the Forex market is decentralized.
Therefore to count volume in Forex brokers use the number of ticks/changes in price.
1 tick measures 1 volume. As it moves up and down volume adds up.
the ifc trade terminal platform has several indicators for volume, I had to look for a long time to find it, but it is very useful:)
learningtotrade.com has their own software, which also has serious volume indicators
ya nice but it will choosen than other tools
OK where is the download for Volume?
fxcm doesn't have volume indicators,
The analysis is good.Can this work using MACD on an Hourly Chart? Again does it work only on MT4 platform alone?
It works on all platforms.
With MACD it's totally different. MACD shows a difference in between 2 moving averages, it's not the same as measuring Volume.
Looks great - I am having trouble finding the link - could someone post the link please?
Thanks
On MT4 you have the standard Volume indicator built in.
To add it to the chart:
1. Right click on the chart,
2. Go to properties
3. Choose Tab called "Common"
4. Find the line that says "Show Volumes" and activate it.
Also, there I have 2 custom Volume indicators (colored and with an average line):
Volumes.mq4
VolumeAverage_v1.mq4
Good tutorial about volume
Hi, on the volume averages_v1 or volume custom indicators there are colors and i am not sure about the color represent. Example if its green bar it present the volume is increasing and red is represent volume is decreasing, but how about the yellowgreen and orange bar represent ? I am confuse for the color meaning. Please explain more on the color... Thanks alot...
I see no correlation with the downtrend at all. The downtend begins at week 27, but how do you see volume picks up in weeks 27-28? It only increases on the Tuesday and Friday of those weeks. It then decreases in week 29, when the downtrend is at its strongest. And volume doesn't confirm the downtrend until week 34-35.
Brother what you are posting...price less! excellent presentation; nothing i found more simple and better than that..please keep it up. Thank you very much for your time and efforts. Asif.
Thx so much. You are so so clear! But please say something on the figure in the upper left hand corner of the volume chart (15077).
this is an absolutely wonderful post. you are a legend. I did not know the importance and interpretation of volume until i read this post. thank you very very much :D
Tenet 5: Trends are confirmed by volumes
The trouble with this part of the tutorial is that, like many other sources, it depicts volume bars in one solid colour. But, many trading platforms divide the bars into 'value up' and 'value down' and colour-code them accordingly. Is the lesson here that regardless of this tiny little detail, only the length of the bar is what the trader should pay attention to?
[email protected]
Post new comment