 Indicators:
 |

|
|
|


|
MACD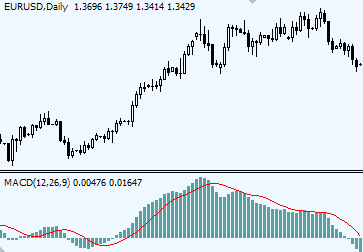
MACD is the simplest and very reliable indicator used by many Forex traders. MACD (Moving Average Convergence/Divergence) has in its base Moving Averages. It calculates and displays the difference between the two moving averages at any time. As the market moves, moving averages move with it, widening (diverging) when the market is trending and moving closer (converging) when the market is slowing down and possibility of a trend change arise. MACD for MT4 collection
MACD Quick SummaryTrading with MACD indicator includes the following signals: Basics behind MACD indicator
Standard indicator settings for MACD (12, 26, 9) are used in many trading systems, and these are the setting that MACD developer Gerald Appel has found to be the most suitable for both faster and slower moving markets. In order to get a more responsive and faster performance from MACD one can can experiment with lowering MACD settings to, for example, MACD (6, 12, 5), MACD (7, 10, 5), MACD (5, 13, 8) etc. MACD indicator is based on Moving Averages in their simplest form. MACD measures the difference between faster and slower moving average: 12 EMA and 26 EMA (standard). MACD line is created when longer Moving Average is subtracted from shorter Moving Average. As a result a momentum oscillator is created that oscillates above and below zero and has no lower or upper limits. MACD also has a Trigger line. Combined in a simple lines crossover strategy, MACD line and trigger line crossover outperforms EMAs crossover. Besides being early on crossovers MACD also is able to display where the chart EMAs have crossed: when MACD (12, 26, 9) flips over its zero line, if indicates that 12 EMA and 26 EMA on the chart have crossed.
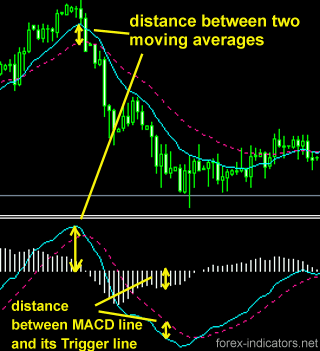
How does MACD indicator workIf to take 26 EMA and imagine that it is a flat line, then the distance between this line and 12 EMA would represent the distance from MACD line to indicator's zero line. MACD histogram measures the distance between MACD line and MACD trigger line.
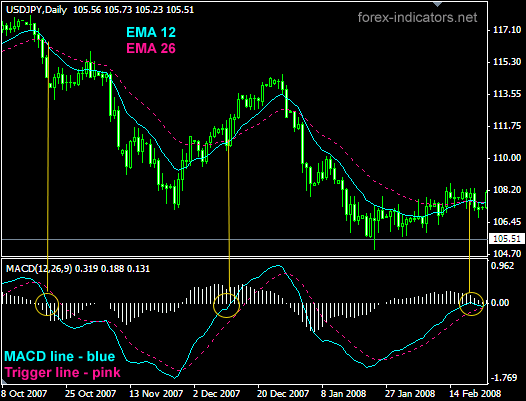
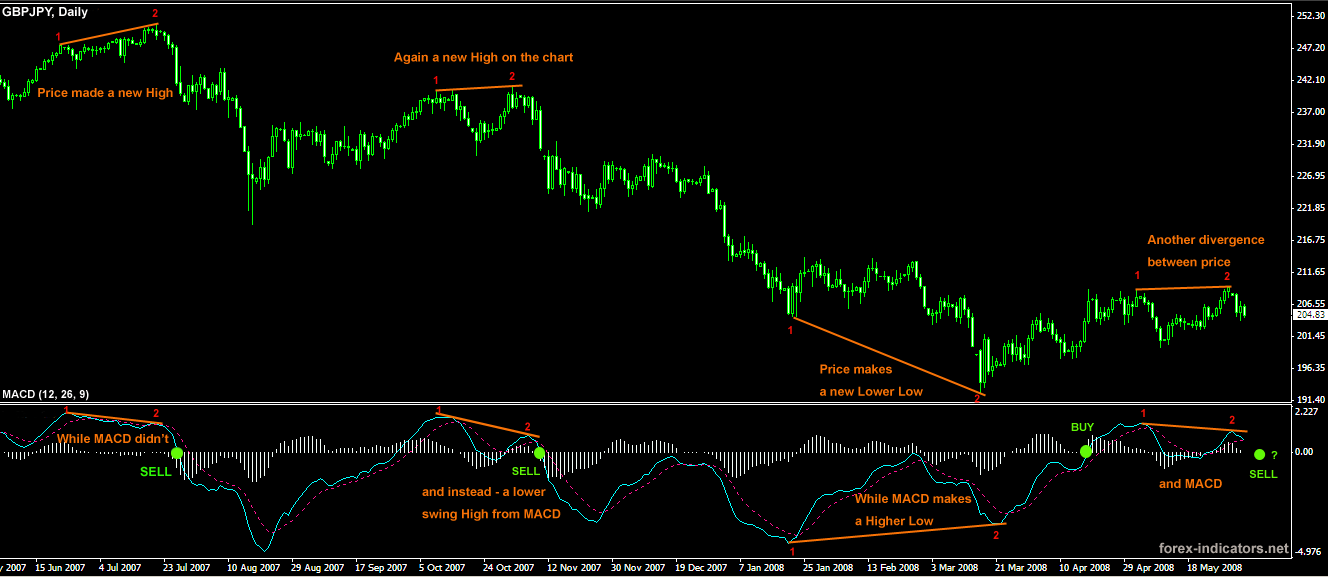
MACD indicator FormulaMACD = EMA(Close)period1 - EMA(Close)period2 where The following are the steps to calculate MACD 1. Calculate the 12-days EMA of closing price Formula for EMA EMA = (SC X (CP - PE)) + PE SC = Smoothing Constant (Number of days) Trading MACD DivergenceMACD indicator is famous for its MACD Divergence trading method. Divergence is found by comparing price shifts on the chart and MACD values. Opposite will be true for Buyers. How to trade MACD DivergenceWhen MACD line (on our screenshot it is a blue line) crosses Signal line (red dotted line) - we have a point (top or bottom) to evaluate. With two most recent MACD line tops or bottoms find corresponding tops/bottoms on the price chart. Connect MACD tops/bottoms and chart tops/bottoms.
With MACD divergence spotted Enter the market when MACD line crosses over its zero point. MACD divergence trading method used not only to predict trend turning points, but also for trend confirmation. A current trend has high potentials to continue unchanged in case no divergence between MACD and price was established after most recent tops/bottoms evaluation.
MACD divergence explainedCopyright © Forex-indicators.net Comments |

 Download:
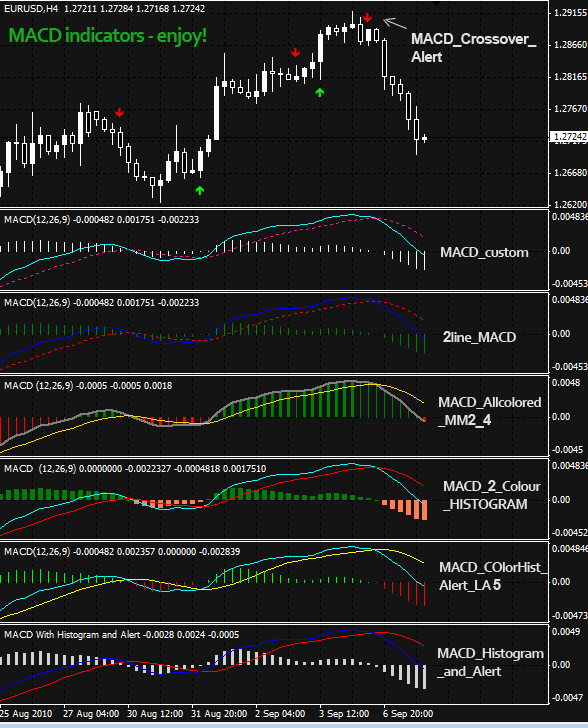
I noticed you look at MACD line to identify divergence.
I learned earlier that traders also look at MACD histogram to trade divergence.
Could you please explain the difference. thank you.
Yes, that is correct. We use MACD line. As you have noticed our MACD indicator has 3 elements: MACD line, a Signal line and a histogram.
Many traders nowadays use MetaTrader 4 platform. There MACD has only 2 elements: a MACD itself which is displayed as a histogram and a Signal line. That is why some traders are saying that they are looking at MACD histogram to trade divergence...
I've found some interesting info + a simple system of trading with MACD:
MACD CROSS and MACD DIVERGENCE. Could be of use to some traders looking to learn basic principles of MACD trading.
Diego
why is it that its when one enters a trading position that the trend ends and reverse on you?
Try trading higher time frames.
You cold be making a mistake common among traders: they set distant profit targets while trading small time frames. With small time frames your targets should be small.
Also when you trade with indicators, you should realise that majority of them lag, give delayed signals. This means that a trend is underway when, in this case, MACD releases a signal.
Trends on small time frames end quickly. When your entry is delayed, because you were using indicators, you've got not much time to profit. That's why targets should be small.
If your goal is to collect larger profits while relying on indicator signals, then you should be looking at daily charts or higher. With MACD on daily charts you'll be able to catch large trends that will last for days or even months, so there will be plenty of time for a trade to develop and profits to be collected before a trend reverses.
pls am still novice on how to apply the MACD. i mean how to plot it. pls help me out
It'll depend on the trading platform you use.
There is nothing wrong about asking your Forex broker to help you with finding and applying the MACD indicator. In fact, they must be glad to teach you the basics of using their Forex platform.
Try it, but if nothing works, come back and we'll figure it out.
Which direction does the price move after divergence.
After bearish divergence price will go down, after bullish - up.
pls how can i get ur macd indicator software
MACD_custom.mq4
Can the MACD system be used for minute to minute trading?
yes, especially if you zoom in the histogram and trade the momentum - when rising histogram stops rising and begins to fall (or after falling - begins to rise).
Also a flip across zero level can be traded too.
you metioned a "TRICK" in your video above:
"buy in on the stock near the SUPPORT LINE.
If the stock closes below the SUPPORT LINE (in case
of a long trade), exit the trade at the next bar at least, never get caught
in a trade closing below the SUPPORT LINE on a second bar- A iron clad rule.
question: what is the SUPPORT LINE you mention?
These are trend lines, which act as support and resistance levels.
Trend lines should always be present on your trading charts.
Hi, I am using H4 and have been trying to track types of candlesticks comparing with the histogram but finding it rather impossible since the bars move while the candlestick changes (up and down), I thought by seeing the height of the bar on the histogram i can see if to catch even small trends and make small profit from it, is this wrong?
what i'm doing is as soon as a new candlestick is created i place an order so if the histogram bar is shorter than the previous one i then sell (immediately), is this wrong? there MUST be something i'm doing wrong because sometimes that candlestick extends causing the histogram bar to sometimes extend too which means my current "selling" order is actually wrong then?
Do i still have to use this indicator with others or can i use it on its own? I was under impression it's different to the standard MACD that you get with MT4 as the standard indicator one would normally use RSI, Stochastics and bolinger bands with it, please help, thanks
It appears to me you're doing everything right, just a bit too early. The candlestick you're watching has to Close, before you can evaluate its corresponding histogram bar on MACD. That's it.
The custom MT4 MACD uses the same formula as any other MACD, the difference is in the way the data is being displayed. By running 2 MACDs together (regular and custom) you'll be able to figure out which line corresponds to which in no time.
what are the best settings for scalpers (short TFs) ?
As suggested, you can try shortening the MACD period settings to get a faster response:
MACD (6, 12, 5),
MACD (7, 10, 5),
MACD (5, 13, 8)
etc.
However, standard MACD should not be overlooked, even on small TFs.
On the other hand, it could be more rewarding to actually widen the MACD period in order to eliminate as much of the noise as possible. Try doubling the MACD settings (26, 52, 9), or try some custom settings, such as MACD (40, 90, 9). Take a look now how a new MACD smooths out the trends.
Hi,what is the difference between classical divergence & reverse divergence in MACD?
Thank you for your question.
There are 2 types of divergence: regular (classic) and hidden.
In an up trend:
Regular MACD divergence occurs when price is making new Highs, while MACD is not.
Regular MACD divergence suggests a main trend reversal.
Hidden divergence in an up trend occurs when price is making new lows, while MACD is not.
Hidden MACD divergence suggest ending of the temporary pullback against the main trend.
In a down trend:
Regular MACD divergence occurs when price is making new Lows, while MACD is not.
Regular MACD divergence suggests a main trend reversal.
Hidden divergence in a down trend occurs when price is making new highs, while MACD is not.
Hidden MACD divergence suggest ending of the temporary pullback against the main trend.
Notice the highlighted areas where it would be a good place to Buy or Sell. The timing for an entry is picked using the MACD histogram, e.g. as soon as divergence is spotted, Forex traders can start waiting for MACD histogram to flip over its zero level to the opposite side, and then enter a trade safely. Those who don't want to wait, can try entering as soon as MACD divergence is spotted on the chart.
MACD divergence (regular and hidden) can be traded across all time frames. However, the higher the time frame, the more reliable the signal becomes.
Nice page. It would be very interesting to look and 1st and 2nd derivative of the divergence. Is this used?
I've never used it, and neither heard of anyone using the derivatives of the divergence in trading. May be there are such methods, but I don't know anything about them to be able to offer any useful insight, sorry.
I'm new to trading and I'm in lots of confusing which indicator is used. So, from your point, If you are in beginning stage which one you used?.
Thanks
Post new comment