 Indicators:
 |

|
|
|


|
Stochastic Indicator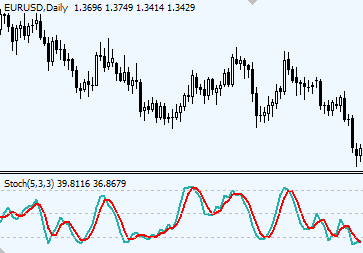
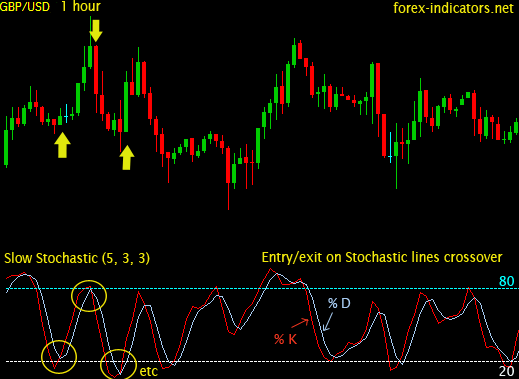
Stochastic SummaryTrading with Stochastic indicator involves the following signals: Stochastic lines cross — indicates trend change. Stochastic DetailsThe idea behind Stochastic indicator The main idea behind Stochastic indicator according to its developer, George Lane, lies in the fact that rising price tends to close near its previous highs, and falling price tends to close near its previous lows. How to interpret Stochastic indicatorStochastic is a momentum oscillator, which consists of two lines: %K - fast line, and %D - slow line. Stochastic is plotted on the scale between 1 and 100. How to trade with Stochastic indicatorLet’s look at three methods of trading with Stochastic indicator. Method 1. Trading Stochastic lines crossover This is the simplest and common method of reading signals from Stochastic lines as they cross each other. Stochastic %K and %D line work similar to moving averages and: Stochastic lines crossovers that happen above 80% level and below 20% level are treated as strongest signals, compare to crossovers outside those levels. Traders may choose sensitivity of their Stochastics. The smaller the Stochastic parameters, the faster it will react to market changes, the more crossovers will be shown. Sensitive Stochastic (for example 5, 3, 3) is useful for observing rapidly changing market trends. But because it is too choppy it should be traded in combination with other indicators to filter out Stochastic signals.
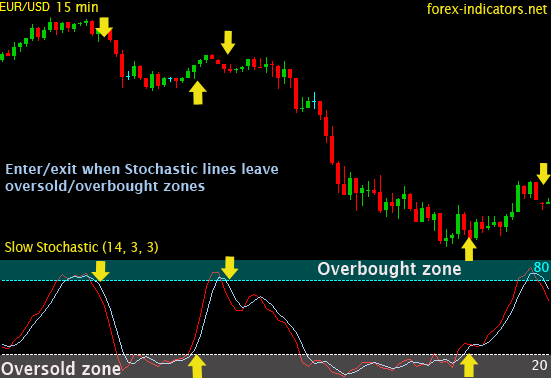
Method 2. Trading Stochastic oversold/overbought zones Stochastic by default has 80% level, above which market is treated as overbought, and 20% level, below which market is considered oversold. It is important to remember that while in sideways moving market a single Stochastic lines crossover that occur above 80% or below 20% will most of the time result in a fast predictable trend change, in trending market could mean just nothing. When price is trending well, Stochastic lines may easily remain in overbought/oversold zone for a long period of time while crossing there multiple times. That’s why a method of trading overbought/oversold zones stands up. The rules here are to wait until Stochastic lines after being in overbought/oversold zone come out from it. E.g. When stochastic was trading for some time in overbought zone – above 80% level, traders wait for the lines to slide down and eventually cross 80% level downwards before considering to take Short positions. Opposite for Long positions: wait till Stochastic lines come into the oversold zone (below 20% level); wait further until Stochastic lines eventually cross 20% level upwards; initiate a buy order once Stochastic lines are firmly set, e.g. a trading bar is closed and Stochastic lines cross over 20% mark is fixed.
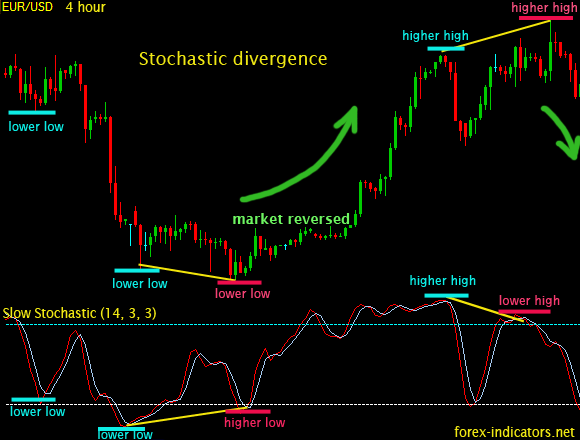
Method 3. Trading Stochastic divergence Traders are looking for a divergence between Stochastic and the price itself. At times when the price is making new lows while Stochastic produces higher lows creates dissonance in the picture. It is called divergence. Divergence between price and Stochastic readings suggest a forming weakness of a main trend and therefore its possible correction.
Full versus Fast versus Slow stochasticFull Stochastic indicator has 3 parameters, like: Full Stoch (14, 3, 3), where the first and the last parameters are identical to those found in Fast and Slow Stochastic: Forex trading strategy using Stochastic indicatorStochastic indicators formulasFull Stochastic Formula
Fast Stochastic Formula
Slow Stochastic Formula
Copyright © Forex-indicators.net Comments |


ITS VERY GOOD
REGARD JATIN
very simple but very nicely explained.
Thanks
Vasant
Im impressed. Thanks Sanjoy
thank you , it is very clear explanation , I hope you explain RSI indicator ( Relative Strength indicator ) with the same clear charts .
Thank you for your feedback, guys!
You're also right, I should do some work RSI indicator too.
Man that was well explained in such few lines, I looked the explanation somewhere else and so far yours is short and well presented.
Thanks!!
Thanks a lot. You are a teacher that teaches what matters most to your students. Thanks again. Henry C
being a novice trader i was a liitle worried that i would'nt be able to get my head around these charts. After reading through this explanation all is clear. Thanks for making it so easy to understand. Great tutorial!
Great explanation, excellent job, congratulation and thanks
Yes your website is verry clear to understand indicators, when ill trade some winning trade, i think ill make you a donation, hehe
thanks
Yeah thanks, the explanation is shot but covers all the silient parts. wish you 'll do the same for rsi and some others.
Gana Lazhi Doko.
excellent
simple explains and covers much information clearly
Thank you! I'm really glad you like it!
Thanks, I really appreciated the tutorial because it is easy to understand as you stated the data with clear explanation and formulas. Awesome! Seems U got much savvy in this aspect. TIPTOP!
Couldn't found what to say cuz of excellence, and the method of teaching... never seen before, TIPTOP!
novice trader
Baha
Good job well done buddy'
Hai,
I have heard that the experienced players are using double or triple Stochastic inidcators with different parameters and they are enough for them if they have learned to use them correctly. If so, how do they use? Please reply.
Abdullah
(Demo account stage)
Hi Abdullah,
when using double and triple Stochastics, the main idea is to let the longer period Stochastic to show a trend, while the smaller period Stochastic will give entry/exit signals. Forex traders would pick only those signals, that go with the direction of a trend.
As an example, Forex traders can use 34, 5, 5 and 5, 3, 3 Stochastics together.
Hi,
Great info on the Stocastic Indicator -- thanks!
I'll check out your website.
Tom
Hi!
I am trading in comex gold
I have three questions
1. For trading in gold on daily basis which time horizon graph should one give most impotance for maximum profit
2.Which are the best four indicators which when used give best results in Comex Gold trading
3.Which are the best available live software trading based sites in Gold
from: avidiamonds39(at)yahoo.co.in
Try focusing on 1 hour and daily charts.
I'd believe that for your purposes you can use the same set of indicators, among which I would try MACD, Stochastic, then possibly also Parabolic SAR and some Moving averages. MT4
Custom indicators would also be worth your attention.
Unfortunately, I can't help with the software question.
Hi,
many thanks for Your great help for us!!!
I have any question - know You how indicators are using on this video above PLEAS??
This strategy is very attractive, but any MA - which I try - not crossover 80/20%.
Thanks thanks.
Frantisek Hulvat
I'm not sure if I understood your question. Please feel free to ask again.
In the video it night be 5, 3, 3 Stochastic - the default settings for Stochastic in MT4 platform. The oversold/overbought zones are set to 20/80 by default, but some traders may also use 30/70. I believe it's 20/80 in the video above.
Hi,
I am not sure which stochastic line is %K and %D?
Can I say that the smoother line is %D? But sometimes both lines are so similar.
During the setting of Stochastic Slow, can I assume color 1 is always = %K, while color 2 is always = %D?
How to display/set the horizontal line of 20 & 80 (can view on the screen).
Thanks so much for your help.
Cindy
Post new comment