 Indicators:
 |

|
|
|


|
Average Directional Index (ADX)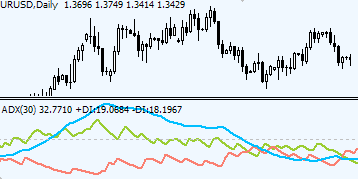
ADX Quick SummaryTrading with ADX indicator involves the following signals: ADX moving above 20 level — trend is strong. ADX passing 40 level — trend is extreme. ADX value rising — trend is going stronger, falling — trend is weakening. +DI stays on top of -DI — uptrend is in place. -DI stays on top of +DI — downtrend is in place. Two DI cross — trend is changing. Average Directional Index (ADX)The Average Directional Index (ADX) depicts a presence or absence of a trend. ADX advices on the strength of the dominant forces that move market prices here and now. In other words, ADX advices on trend tendencies: whether the trend is going to continue and strengthen or it is about to lose its positions. The author of Average Directional Index J. Welles Wilder considers his ADX indicator as a primary achievement; and only because signals given by ADX are not an easy to take a grasp of from the first look, many Forex traders avoid using ADX in favor of more visually comprehensive indicators. How to interpret ADXADX indicator has 2 lines: ADX itself (white), +DI (green) and -DI (red). That is, basically, the simplest explanation of the purpose of ADX. ADX allows Forex traders to determine whether the trend is strong or weak and thus choose and appropriate strategy to trade with: a trend following strategy or a strategy fit to consolidation market periods with no significant price changes. There is also additional line to be added to ADX indicator window - at 40 level.
How to trade with ADXTrading with ADX looks as follows: If ADX is traded below 20 - there is no trend or the trend is weak, thus a non-trend-following strategies should be used, otherwise losses may occur as a result of false signals and whip-saws taking place. An example of non-trend-following method is channel trading. If ADX is traded above 20 but below 40, it is time to apply trend following methods. An example would be: Forex trading Moving averages or or trading with Parabolic SAR indicator. When ADX reaches 40 level, it suggests an overbought/oversold (depending on the trend) situation on the market and it is time to protect some profits of at least move Stop loss order to a break even. When ADX passes 40 level, it is a good time to begin collecting profits gradually scaling out of the trades on rallies and sell-offs and protecting remaining positions with trailing stops. ADX -/+ DI lines are used for spotting entry signals. All -/+ DI crossovers are disregarded while ADX remains below 20. Once ADX peaks above 20 a buy signal occur when +DI (green) crosses upwards and above -DI (red). A sell signal will be the opposite: +DI would cross -DI downwards. ADX indicator is never traded alone, but rather in combination with other indicators and tools. ADX indicator most of the time gives much later signals comparing to faster reacting moving averages crossover or Stochastic, for example, however, reliability of ADX indicator is much higher than for other indicators in traders' toolkit, which makes it a valuable tool for many Forex traders. And just one more idea to test out: ADX indicator formula
Copyright © Forex-indicators.net Comments |

 Download:
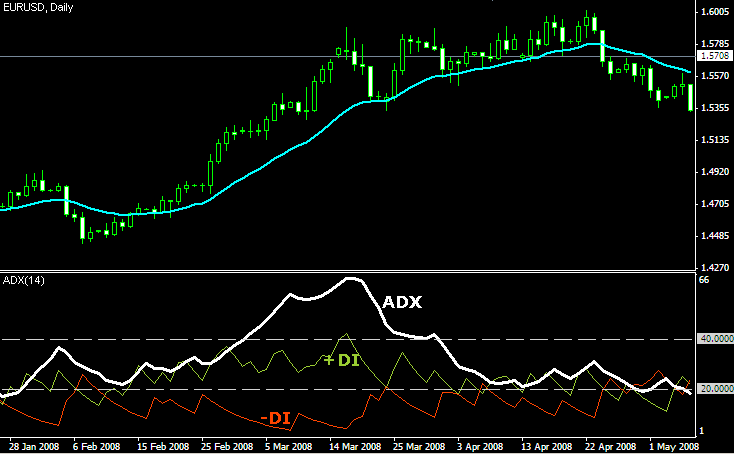
what settings can one use for the ADX in trading short term trades, like the 30min time frame?
ADX indicator standard setting are 14. In most cases it is better to use standard settings just because majority of traders use them; result - everyone sees the same picture and gets the same signals at the same time.
However, with ADX indicator specifically, Forex traders often look for alternative settings.
The nature of ADX indicator allows experimenting with settings to get best performance.
Common range for ADX is from 7 period ADX to 30 period.
For 30 minutes chart try ADX 30.
Check out this link to know more uses of ADX: System Selection technique
For Stock market ADX settig is set to 10 as default, but in Forex i think for the most case 14 is the best choice
should i use ADX with the weekly, daily, or 15 minute chart?
any chart, I use it even on 5 min as a trend filter for scalping here and there.
will default settings for ADX (ie) ADX14 will suit trading on 15 Min chart?
yes, it will.
hi, does ADX come with all MT4 platform
u are doing a wonderful job. God bless u
Thank you! Glad you like it.
Yes, ADX comes with all MT4 platforms. You'll find it in MT4 under Trend indicators, under name "Average Directional Movement Index".
Found ADX useful, show sell signal... Google and found this page, short and simple. Thanks U Guys.
ADX indicator is a good help but only with other supportive indicators like RSI or so.
sir your is very good human,thanks all very very best explanation
I agree with the rest of the traders, this site ROCKS! thanx for your explanations. they are simple n easy to understand. I will recommend this page to all my FX buddies, be blessed-Mightily.
Google -> your site -> understanding :) thanks very much. I was searching long time for easy to understand explanation.
Thank you!
It's great to have so many people discovering the powers of indicators!
is there a bug in MDI formula? I'd prefer MAX(L(t-1)-L(t),0)
No, I don't think so.
But double-check with other resources.
I want to thank a friend for a novice not to have trading in the demo so real and yesterday I discovered your site.
Quero agradecer ao amigo pois sou novato nao to ainda negociando no real so na demo e ontem eu descobri seu saite tenho apreendido muinto e embreve ja irei operar na conta real pois suas explicaçoes estao a me dar confiança obrigado mesmo e sertamente estarei de olho no seu saite ok.
When a strong trend is in play and reverses to a strong trend in the opposite direction, what should we look to see in the ADX? If you wait for it to go back to 20 and rise above you have missed the strong trend in the opposite direction. How do you recognize this situation before it's too late? Thank you!
You should add E=MC2(r-xd)(rxl)-x2(m-lc=4)
When a strong trend is changed by an opposite strong trend, ADX indicator is totally useless.
Basically, as soon as ADX starts to decline from the top 30-45 levels, it no longer posses any interest as it can't reflect a change in a trend. Traders can only refer to +-DI for trend confirmations.
Would you kindly show me where to add the new line. Thanks in advance
keep the good jobs
Post new comment