 Indicators:
 |

|
|
|


|
FOREX VOLATILITY INDICATORS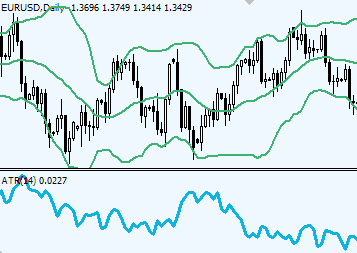 Volatility indicators show the size and the magnitude of price fluctuations. These periods come in waves: low volatility is replaced by increasing volatility, while after a period of high volatility there comes a period of low volatility and so on. Volatility indicators measure the intensity of price fluctuations, providing an insight into the market activity level. Forex Volatility Indicators:
The methodology of using Volatility indicatorsLow volatility suggest a very little interest in the price, but at the same time it reminds that the market is resting before a new large move. Low volatility periods are used to set up the breakout trades. For example, when the bands of the Bollinger bands indicator squeeze tight, Forex traders anticipate an explosive breakout way outside the bands limit. A rule of thumb is: a change in volatility leads to a change in price. Comments |

plz explain the bollinger bands.I shall be greatly indebted.thanks for all the stuff till now!!!!!!!!!!!
Thank you. I've added Bollinger bands page. Happy trading!
all indicators are repaint
all indicators are repaint(above statement)
SO WHY ARE YOU HERE?.. LOL..
Post new comment