 Indicators:
 |

|
|
|


|
Market Facilitation Index (MFI)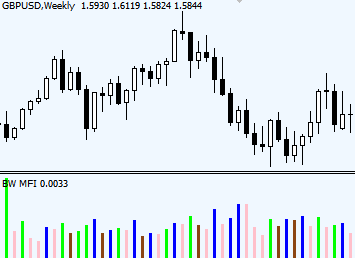 "The MFI is a measure of the market's willingness to move the price. I cannot overemphasize the value of this indicator. It is a more truthful measure of market action than any stochastic, RSI (Relative Strength Index) or other momentum indicator." Bill Williams
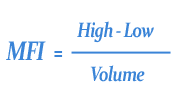
In his book "Trading Chaos" Bill Williams introduces a new method of combining price and volume in order to see the true market development. The key role belongs to unique indicator called the Market Facilitation Index (MFI).
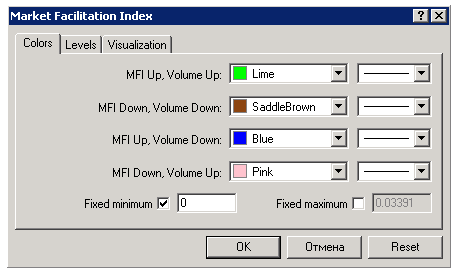
and allows to evaluate the efficiency of the market price movement. What does efficiency means here? An efficient market is seen as liquid and active market where all types of investors (long-term and short-term traders) are actively involved in buying & selling. Should the interest of one large group of investors vaporize, the volume drops and from that point efficiency of the market goes down as well. How to interpret BW MFIMFI can be used for all time frames from 5 minutes up to daily and weekly frames. To call it on MT4 charts: Insert -> Indicators-> Bill Williams -> Market Facilitation Index If not available, you can download the same indicator here: and place it in your installed MT4 folder inside /Experts/Indicators.
With BW MFI we don’t analyze absolute values of the indicator (be it 0.0030 or 0.0055), but rather focus on changes of price at any single moment.
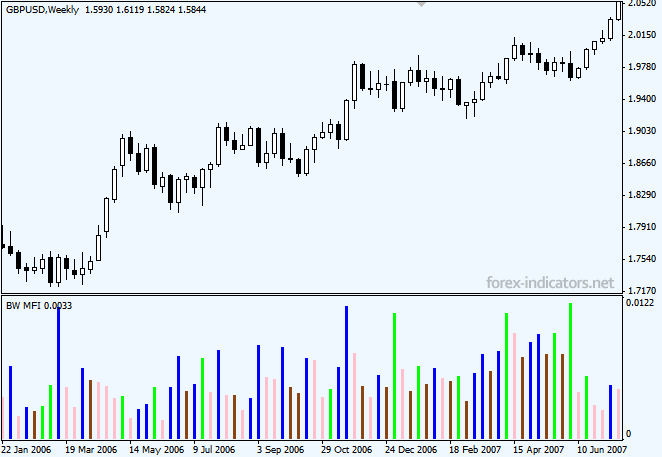
All that’s left to do is to know how to read and interpret different colors given by MFI indicator. How to read BW MFI indicator colorsThere are 4 possible combinations of MFI and Volume relationship, which are colored in BW MFI indicator with the following message to send:
Green MFI bar tells that the market is already on the move. Therefore, traders’ best immediate reaction should be to go with the market, whatever direction it is heading. Brown MFI bar (called Fade) appears when market starts to fade – lose interest in advancing further. Often this can be observed at the end of a trend. Traders who used to actively participate in the market are no longer interested in establishing new positions at current price, which causes the market to fade (both volume and MFI decrease). Bill Williams brings as an example Elliott waves, where the fist Elliott wave in the sequence has a fade top - little action is happening, and the excitement of the market is dwindling. Yet, he says later, that boredom often precedes the beginning of a big move. "So the very time when the market is most boring is exactly the time when a good trader must be on guard for any sign that momentum is building" – says Bill Williams. Blue MFI bar (called Fake) has been given its name for a reason. When market makes a progressive move, but this move is not supported by the volume (for any reason), this provides a clue that there are probably no real interest in the move yet, while certain group of market participants is trying to control and manipulate the market to their advantage. This is the point when newbies can be easily scared out by sudden change in the dominant trend, which will cause them to close their existing trades and attempt to run with the new trend, which to their huge disappointment will be over as fast as it began, since it was not a real move backed up by volume, it was a "fake" move, controlled by a small but strong group of large market players. Pink MFI bar (called Squat) appears at the end of each trend. Bill Williams calls it "the strongest potential money maker" of the 4 setups. The squat bar is marked by an increasing volume yet temporary stalling price movement. The key factor is: there are many participants entering the market, all of them are enthusiastic about selling & buying (volume rises), but before the battle between buyers and sellers finds a winner, the price movement stops – market sort of squats before leaping forward. The breakout is going to be either seen as a reversal, or a continuation of a current trend. Either way, it is a good starting point to get in at the beginning of a trend. Copyright © Forex-indicators.net Comments |


Interesting that nobody has commented on this indicator yet?
I have a feeling that this could be a veru useful indicator but I just don't get it.
I have it on my chart with the Traders Dynamic Indicator (Compass FX)and a slow stochastic (8,3,3). I've resarched this MFI until I'm blue in the face.I even read a fairly detailed article by Bill Williams himself. I still don't get it! Am I missing someting?
Could you add anything that might turn the lightbulb on for me?
Thanks
Stephen
I understand the indicator, i just don't really like it. Too many false indications.
I want to thank you very very much for explaining this important indicator, personnally i want to know more about it, can you advice me some other places where to find more on it, because i see that with more filter indicator this ccould be a support for any decision of a trade.
This is awsome indicator! Understand it and you will be 80% winner!
Then help us understand it! Please?
This is not the easiest of indicators to understand. As always, to an inventor (Bill Williams) the indicator is very useful in its every detail, but for us, followers, sometimes many things and, most important, the reasoning why this indicator was created - remains undiscovered.. That's where you'll hear that following someone's system doesn't mean it'll work for you.
The best way to learn about the indicator in depth is to read the original book "Trading Chaos" by Bill Williams, but don't look for easy answers there, it's the same complicated description as anywhere you look.
on it's own, this indicator will give you false signals. I will try to explain how I use it in conjunction with other trading methods. I executed a trade today 9/24/10 on gbp/jpy. If you pull up this chart, you will see that thursday's candle was a doji which formed after somewhat of a downtrend. It also formed right on the weekly pivot and it was also an inside bar or harami if you wish to use candlestick jargon. I felt that this pair was going to reverse bullish and the last thing that confirmed this sentiment was that the MFI was brown, meaning that further selling was unlikely. I have charts posted on forexforums.com. Just search for "price action" or sniper012 just so you can see it visually and also so you will know that I'm not monday morning quarterbacking.
Thanks for the explanation, Considering that volume indicator reflexes the broker's trading volume only and not the whole market since it's not possible, In MFI the volume is essential part of its equation does that mean that MFI accuracy depends on brokers given volume accuracy?
instead of using this rather confusing indicator it is probably better if you observe the volumes indicator and the price movement yourselves...this indicator seems to be an attempt at combining both and dumbing it down but ends up being more complicated and hence less effective.
The value of this indicator is as a confirmation...not as a signal. Even so, I find that 1- it only accurately confirms about 65% of the time and 2- It filters out over half of the good trades I would normally do. A much simpler and more accurate confirmation of volume & direction is the OBV when combined with a 3 EMA signal line in the same window. Even so I would never trade without a fast moving ATR to verify volatility because volume does not always equal volatility. The BW MFI tries to combine the qualities of Volume and ATR into one indicator but, in my opinion it is not near as good using the OBV and ATR. Again, thank you for providing a very good explanation of a very complex indicator.
From THE LONETRADER
I have read the book and believe me, much complicated.Perhaps it works better on futures exchange since exact knowledge of volume and tick volume.
Please reply if I am wrong.
Many thanks
This indicator can not be used alone, but must be accompanied by other indicators. What should be monitored and the most important of these indicators are green and pink, others simply viewed with a skeptic attitude.
for THE LONETRADER
Please reading the book Trading Chaos carefully. This was very frustrating initially, but eventually will be very useful to know the end of a trend.
Volume and tick volume is another thing, this is a different matter from MFI.
I am a FMI indicator fan but it has to be used with other complementary indicators such HI-LOW of a FMI green bar less than 1.5ATR for the that time bar, an ADX less than 26 and a well defined trend. With that, you will have a bunch of winning transactions if you accept a 1:1 winning ratio on each transaction.
Great indicator. Obviously you need to have a good understanding of the basics of Forex first to enable you to interpret the MFI.
those who really want to use MFI, can really make money with it.
However, many traders not really understand the main explaination in the book BW Chaos Trading.
That's why BW said the application is for advance trader....
In order to easy understanding the book, i suggest to read and understand the related signal on other indicators (fibonacci, oscilator, etc).
The MFI bar size shows price action similar to the volume indicator showing volume action.
Compare this indicator with the volume indicator from the navigator menu in MT4. You will find that you can only get MFI green and pink bars in line with volume green bars. Also MFI blue and brown bars line up with red bars on the volume indicator.
As The height of each volume bar is compared with it's previous bar it gets colored red for lower and green for higher. The MFI compares price movements with each previous bar and considers volume in it's color scheme.
It's nothing more than a volume like indicator for price movement that includes volume action in it's color coding.
Now all we need is to do chart the volume and histogram the price action with the MFI!
This is an interesting indicator.
Another possible indicator made from the MFI could be to have bull bars print above the zero line and have bear bars print below the zero line.
What implications this would have I don't know but it would be fun to experiment with.
I've been having problems with this indicator when a giant blue fake bar appears. These usually single giant bars squish the rest of the data into the zero line making the MFI unreadable until there are enough time periods to get rid of them. Is there any MFI alternative out there that can remove these things? I'd rather see a shorter white bar or a short fat blue bar in it's place to note it's presence.
can yuo make just symbols above bars instead to have separate indicator window as it is now?
Really nice explanation. I think I understand the point, thanks
I trade with just the Green(UP Volume) Line. All others ae blacked out on the color selection. Using a 30 min. chart ,I wait for 2 consecutive green lines to appear.
This gives me the trend,I go off the last bar traded.Usually you can get into the trend in it's earlier stage.It's working for me.
good explanation indeed, i have back tested this indicator on eur futures back to 99, the best it did was a 67% success rate, which was pink bars on a weekly time frame, on daily and lower its really a 50/50 shot, however the indicator is valuable as it shows the vol and price spread relationship, for instance when a pink bar appears there seem to be a battle between bears and bulls, and if the opposite trends win we will see a reversal, but also if the prevailing trend is strong we may see a for of acceleration in trend,
in my opinion it is not important size of bars...it is important interpretation and meaning of the bar ...that's why it would be great if someone can make this indicator to be on price chart represented by some symbols like *, diamond, circle, dot, square...whatever...just to be on chart.
Please read the chapter "Using fractals and leverage" from Trading Chaos by Bill Williams carefully, I think then you will be able to appreciate the usefulness of the indicator. Fractals, MFI and other Bill Williams indicators are perhaps the best indicators available. I am a trader just like you all and I try to learn while I earn or loose(I earn more though). Take my suggestion and put your mind on this strategy, you wont regret. All the best
Post new comment