 Indicators:
 |

|
|
|


|
FOREX MOMENTUM INDICATORS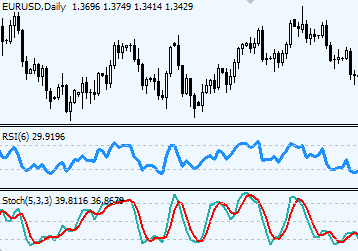 Momentum indicators in Forex records the speed of prices moving over certain time period. At the same time Momentum indicators track strength and weakness of a trend as it progresses over a given period of time: - The highest momentum is always registered at the beginning of a trend Momentum Indicators list:
How to trade with Momentum IndicatorsWith Momentum indicators Forex traders look for controversy between chart prices and Indicator suggestions: A. directional divergence between the price and momentum signals of a trend's developing weakness. B. price spikes that occur during weak momentum, are the last warning signals of the trend change. C. also trend change should be expected during sideways moving prices and controversially strong momentum. Momentum indicators, such as RSI and Stochastic, are favorite indicators for non-trending markets. Momentum indicators ideally gauge whether the market is overbought or oversold during its non-trending state, and highlight potential reversal points before those actually occur. Comments |

The two best momentum indicators are seems to be Stochastic and RSI. I'd like to learn more about RSI trading please. How to combine those indicators. Also why momentum trading is so popular, what's its importance exactly in. Thank you.
Momentum trading in Forex or any other market is all about being able to get in and out of a trade at the right moment - at the moment where market is gaining initial strength/momentum and runs first few miles with great confidence and without looking back. When momentum is decelerating or lost, an uncertainty sets among investors as they try to re-evaluate their chances for further profitable price chasing, and the big nice rallies or sell-offs are slowing down yielding no more profit potentials till the next momentum.
Momentum indicators help to catch that "Here and Now" time to place orders and lock in profits.
It is true that two most popular indicators in Forex remain to be Stochastic and RSI.
Although just one of them will be enough to identify periods of forming momentum in Forex market, you may combine two indicators in order to refer to either one or both of them when expectations for new trading opportunities are high.
The best explanation on combining two momentum indicators could only be possible with a help of a specific Forex trading strategy, so we've found an example for you online from a very reputable site
RSI and Stochastic strategy combined
and hope you enjoy it!
Whats the exclusive use of momentum indicator,if all i need to see while investing is the trend and the trend indicator do that job very well. Explain the cons of investing without momentum indicators!!!
That's quite easy to explain.
Trend indicators tell which of the trends (up or down) is in place. Trend indicators also tell when the trend changes or is about to change. But, there is one thing trend indicators cannot show - and this is the very moment at which all "powers of a trend" have gathered the momentum to produce a move.
In simple words, it's a situation when, for example, you know that a trend is up, but you don't know whether you should Buy it now or wait till you get a better price. That's where momentum indicators come in handy. Momentum indicators show the very best moment when you can Buy it having the highest odds that the market will move into your favor immediately without looking back.
Also you can rely on momentum indicators to suggest when the "powers of a trend" (or simply the momentum) is weakening. Using this information you can take decisions on either taking quick profits and be out of the trade or review and re-adjust your trading stops.
Without momentum indicators it would be difficult to time trades (specifically entries) precisely, besides there is a chance to enter a trade when the market has made quite a progress and as a result used all its power (lost momentum) and is preparing to retrace to regain it, leaving late newcomers at the tip of a reversal.
how do you know whether a market is trending or not
When the market keeps making higher highs and higher lows - it is trending upwards and the trend is intact.
When the market keeps making lower highs and lower lows - it is trending downwards and the trend is intact.
Any changes in this sequence invites ranging market reaction.
This subject is further addressed in the comments at:
http://forex-indicators.net/how-to-choose-indicators
In addition, traders often use Moving averages.
Classic example, Alligator indicator: Alligator.mq4
When there is a prefect lineup: blue, red, green - there is a trend.
When lines mix up, there is no trend.
The first uptrend is marked with green circle - shows the beginning of a trend, when all 3 moving averages are lined up.
The red circle is the end of the downtrend - when the green moving average crosses over the red moving average, breaking the prefect sequence.
what is the 3 Moving average line? how many days?
3 Moving average line consists of 3 MAs with next settings: 13, 8 and 5.
See further details for Williams Alligator Indicator
what are the best moving average periods for trading 1 min or 5 mins chart?
If you want to see trends on 1 & 5 min, use 20 SMA. Also price would respect 200 EMA.
Smaller moving averages would only "dance" back and forth with price bars without providing any considerable use.
This is the advice I ever get for Forex so far
LOL at above comment!!!
I just came accross this site today and was amazed at what I saw. Hmm..., Thank you so much for your concern.
What is the best MAs combination for 15m time frame or 30mns?
Depends on your goals. Don't be surprised if someone tells you that there is no ideal Moving average or set of averages. Every one of them to some point hits the perfect trade one time and misses on the other.
Check out this page about Moving averages, in particular the paragraph about most common moving averages. You can certainly use those on 15 min or 30 min time frame.
I need some enlightenment on the use of support and resistance points when trading. Please also clarify me on how to actually place your stop loss. For example you may place it at 10 pips away from your position in line with your money management strategy but some times the price will swing to 12 pips thereby stopping you out only for it to swing back up and make much profit. How do you strike a balance between your money management limit and the possibility of the price crossing your limit and swinging back in the opposite direction?
Hi,
Could you please send/write to me indicator:
Stochastic Momentum Indicator (Index).
I have been able to find its formula for metastock
100 * ( Mov( Mov(C - (.5 * ( HHV(H,13) + LLV(L,13))),25,E),2,E)/
(.5*Mov(Mov( HHV(H,13) - LLV(L,13),25,E),2,E)))
but i need it for
dot net sochastic momentum calculation
C# code or lib
Any help appreciated. Thank you
Atar
[email protected]
would you please telling me about which momentum indicators that has highest accuracy in time frame 5 or 15, and also the best parameter setting of it - absolutelly thanks before
Post new comment