 Indicators:
 |

|
|
|


|
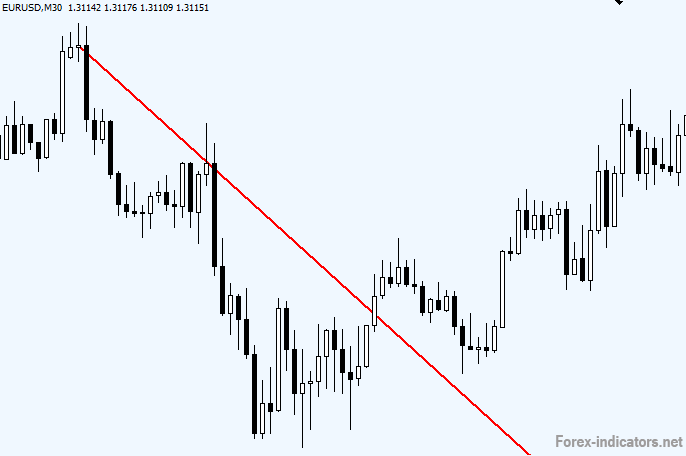
Trend LinesAuto Trend Line MT4 indicators Indicators for automated drawing of Trend Lines.
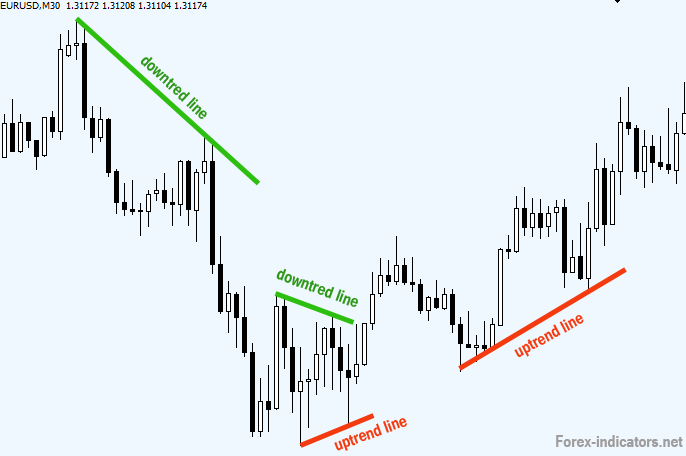
Forex Trend lines are simple to use and easy understand. Whether you're a beginner or a professional trader - you'll always draw a couple of lines on your chart.
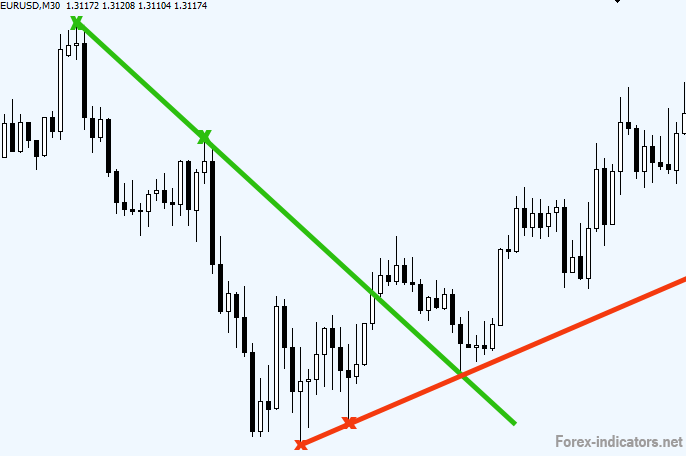
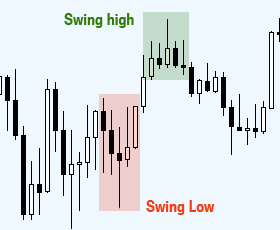
Can you see possible trend lines already? Let's find out: Trend Line RulesRule #1. Any trend line should connect at least 2 tops or 2 bottoms. Rule #2. A top is called a "Swing High" and consists of a minimum of 5 candles: A bottom is called a "Swing Low", also consists of 5 candles:
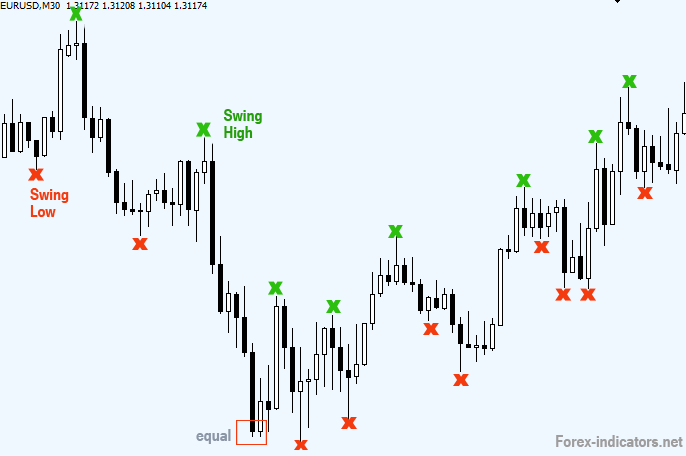
Let's find all Tops and Bottoms that fall under this rule:
If at the top 2 highest candles or at the bottom 2 lowest candles are equal in price, then as per rules we can't officially call them a "Swing High" or "Swing Low", but these are still equally meaningful Support/Resistance levels, and therefore should be used for drawing trend lines when necessary. If you need help with finding tops and bottoms, use Fractals indicator, which will find every single top and bottom for you. Rule #3. Uptrend trend lines are drawn below the price by connecting price bottoms (Swing Low).
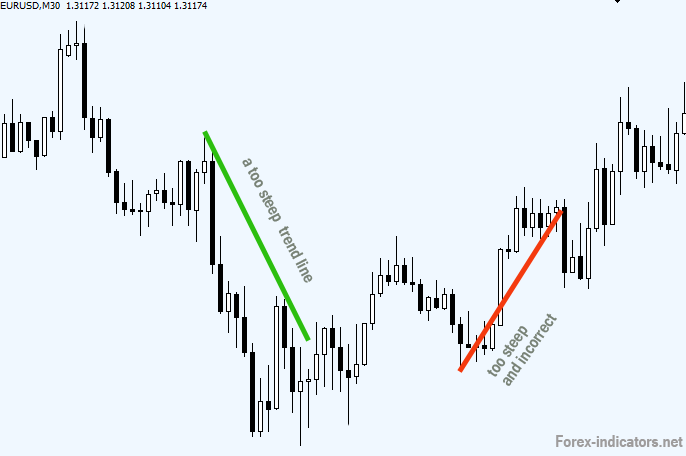
Rule #4. Avoid drawing too steep trend lines as they will rarely be of any use.
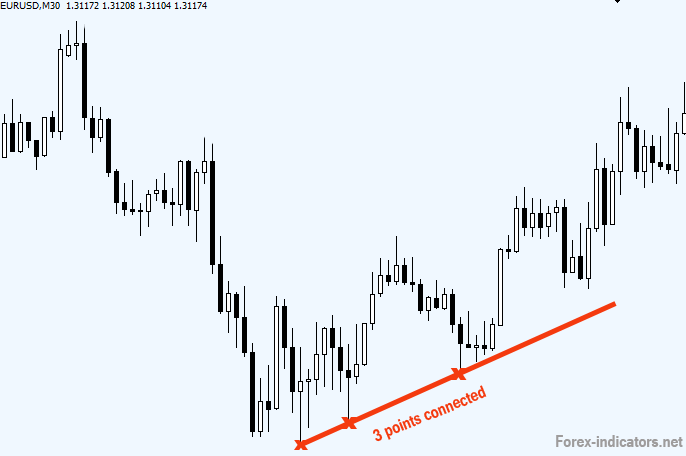
Rule #5. The more tops and bottoms are connected - the stronger the trend line becomes.
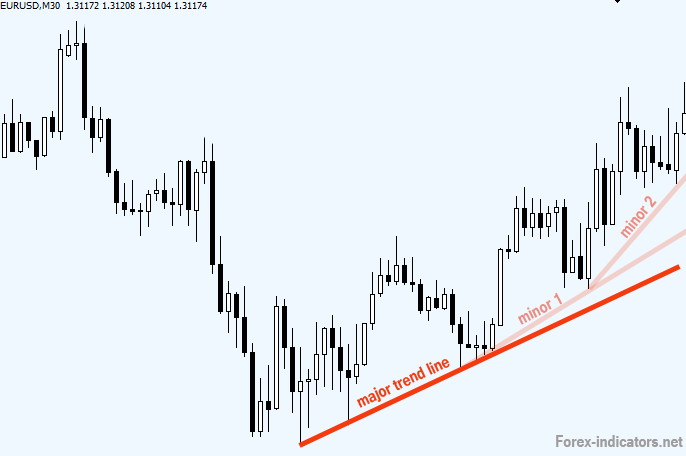
A trader usually draws a trend line through the first 2 points and when the line is tested at point #3 - it either confirms (validates) the trend line or breaks it (invalidates). Rule #6. Besides major trend lines, there could be minor trend lines When the market starts to accelerate, the angle of a trend will increase. In such case the major trend line will hold the main trend, while the new minor (inner) trend lines will help to track the latest price development.
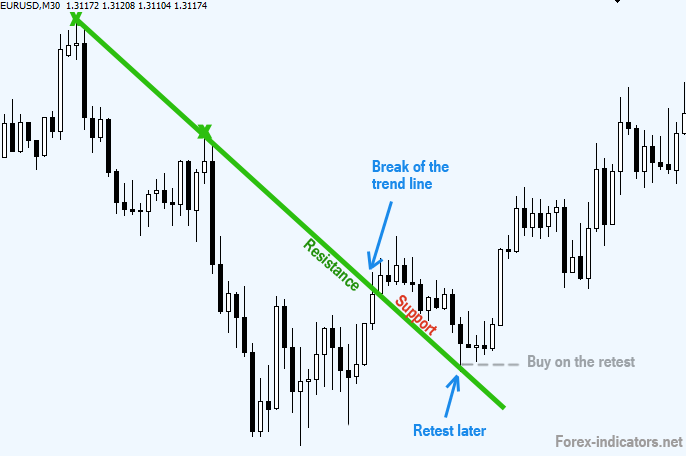
Rule #7. Any trend line sooner or later will be broken. When a trend line is broken, it should stay on the chart for some time, as we'll be expecting a retest of the line in the nearest future: this retest of a broken trend line is an excellent opportunity for opening a new trade.
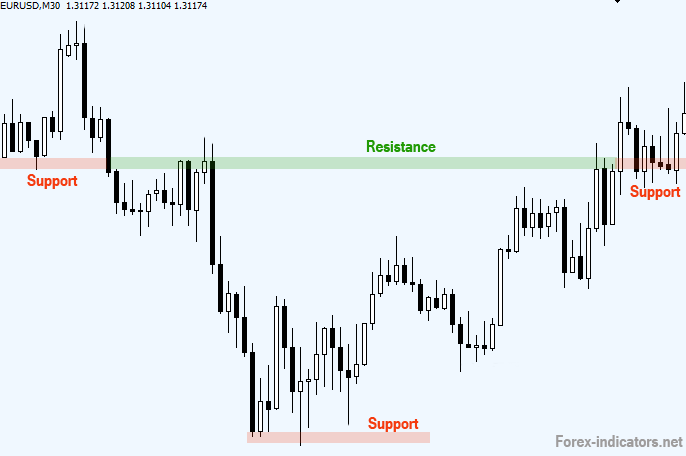
You won't always see such ideal retests of a broken trend line, sometimes there will be a shorter pullback to the broken line without reaching it. Nevertheless, this is a common pattern every trader should be able to recognize. Rule #8. Trend lines can be flat = horizontal. On our chart we don't have ideal double top/bottom patterns, but we can learn a few things from horizontal S/R levels:
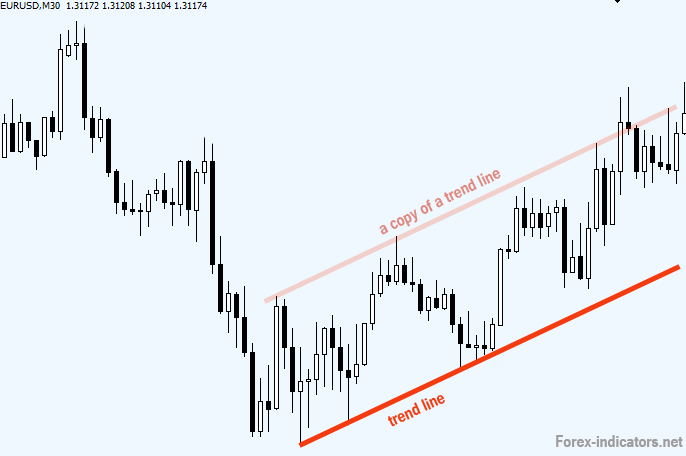
Any horizontal S/R level is rather an area, not exact price. Imagine that you have a marker instead of a sharp pencil, and with this marker you're drawing S/R levels. Now you'll discover that a few spikes through the S/R levels is not an indication of a broken S/R level, but rather a test. The true break comes when price slices through the level without fear usually with a tall definitive candlestick. Rule #9. Trend lines are used to build price channels.
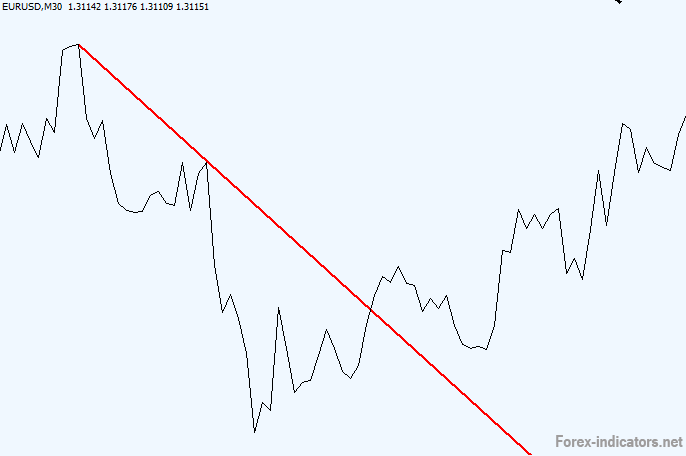
First you need to draw a regular trend line, and then copy it to create a parallel symmetrical line on the other side of the price channel. While you continue trading with the main trend line, a channel helps to project profit targets. Rule #10. Different traders will draw different trend lines while looking at the same chart, which sends the message that the lines you draw might differ from lines drawn by other Forex market participants. The goal is to have the same trend lines as majority would do - this helps to trade with the majority, which is much easier. To achieve that goal focus on the most obvious trend lines (those that everyone would most likely notice and draw), and try to avoid least obvious ones. Rule #11. While some Forex traders prefer drawing trend lines using price shadows, the others would ignore the shadows, and instead use only candlestick bodies (line chart example). To see what this mean, try the following: 1. Switch your chart to the Line chart. Then draw a trend line.
2. Now switch your chart back to the Candlestick chart. notice that your trend line is not using candlestick shadows. Some traders believe that this is the correct way of drawing trend lines (because actual price Open and Close values are more important than intermediate fluctuations), while others disagree, because the shadows reflect actual price peaks and valleys which have own value.
Copyright © Forex-indicators.net Comments |

 Download:
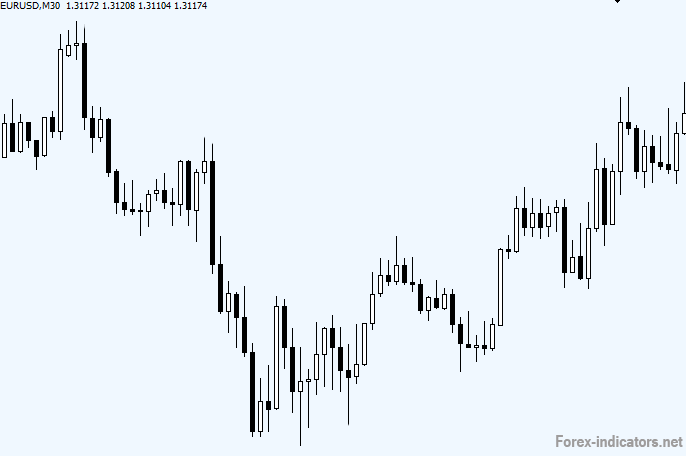
Nice Article and very clear and helpful explanation. Thanks
I love this site at the first sight. I am not a technical-analysis fanatic. Yet, it helps a lot when comes to the basic principles such as trendline.
Thanks
Simple with Good Amount Of Clarity.
Thanks a lot.
Alot of info very short and simple
very helpful site. keep up. kusimba
thanks
thank youuuuuuuuuuuuuu very much for all your efforts in this website.
Best I have seen..
Thanks
Well done. Good work, may you not lack help and information. Please could you give the differences among the automated trend lines? Stay blessed.
Excellent work
very good explanation.. any site for stock with similar explanation..
All download indicators are for for MT4. Where I can find the same for TS?
please i need better understanding about this topic.thanks
super site
Great
simple explanation very useful even for beginers thank you and good wishes
Post new comment