 Indicators:
 |

|
|
|


|
MT4 Indicator (KG_Support_ and_Resistance.mq4)
How to trade with KG_Support_ and_Resistance.mq4This multi-timeframe indicator automatically draws Support and Resistance levels for:
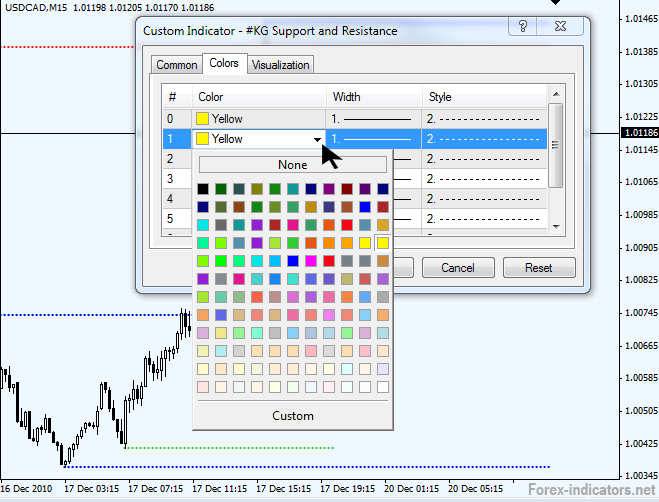
On the 15 min USDCAD chart above the Daily resistance is held beautifully, even though we have a small spike through the level (around 6.5 pips). We'll talk about S&R more our general topics, but you should note here, that Support and Resistance are not the exact price levels, but rather areas of 10-20 or more pips, where the action occur. Settings for KG_Support_ and_Resistance.mq4To remove/hide any of the SR lines, change the color of the lines to match your chart background color, as shown on the screenshot below:
Copyright © Forex-indicators.net Comments |

 Download indicator:
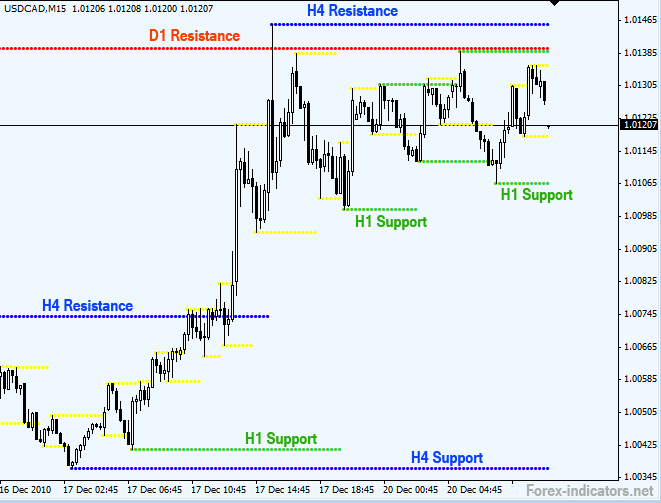
thank you for this indicator. it looks very good one, I will test it and see how it reacts.
Excellent tool in multi timeframe for seeing the supply and demand combined with volume and price action.
Please explain the KG Support and Resistant indicator in detail.
I am new to support and resistant. I think this indicator will make me profit
Thanking You
Ganesh
very nice indicator. Can you edit the code to generate signals to an ea.
Very Interesting Indicator! Can you tell me when the first red or blue dot starts to plot on the chart?
Is it at the beginning of the swing or a few bars after the swing has being established?
Post new comment