 Indicators:
 |

|
|
|


|
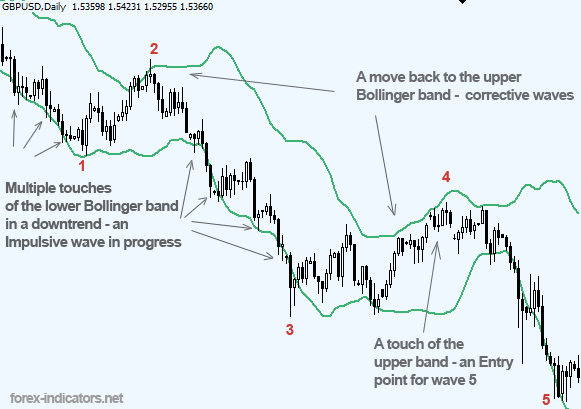
Elliott Waves and Bollinger BandsIndicators required: Bollinger bands (period 25, shift 2) The concept lies in easy spotting & counting Impulsive and Corrective Elliott waves Rules for an Uptrend: Rules for a Downtrend:
Chart tip: To make the middle Bollinger band line invisible in MT4, draw additional bands (period 22, shift 3) and match their color to your chart background color. Summary: Bollinger bands indicator can help with Elliott Wave count: to find impulsive waves, as well as search for patterns in during corrective waves, however, it's not recommended to build trading solely around the Bollinger bands, as you'll get many losing trades. Copyright © Forex-indicators.net |

John Bollinger, the developer of Bollinger Bands, says you should always use an indicator with the bands for confirmation. He has a website that is dedicated to Bollinger Bands and the forex market, BBForex.com. In the BB tutorial there are rules to use when trading the bands that will keep you on the right side of a trade. The charting program on the site is excellent--worth looking at.
good
good indication to find out impulsive and corrective wave. its a better combined use of bollinger band and candlestick chart to trace out elliott wave. thanks----ghanshyam singh
great
Post new comment