 Indicators:
 |

|
|
|


|
MT4 indicator (Color_Stochastic.mq4)
How to use Color Stochastic indicatorColor Stochastic indicator shows overbought and oversold levels. Stochastic readings above 80 suggest market being overbought, Stoch line turns green;
Ability to see these areas at a glance helps to judge about trends and reversals. While Stochastic stays above 80 (green line) - an uptrend is in progress.
Comments |

 Download indicator:
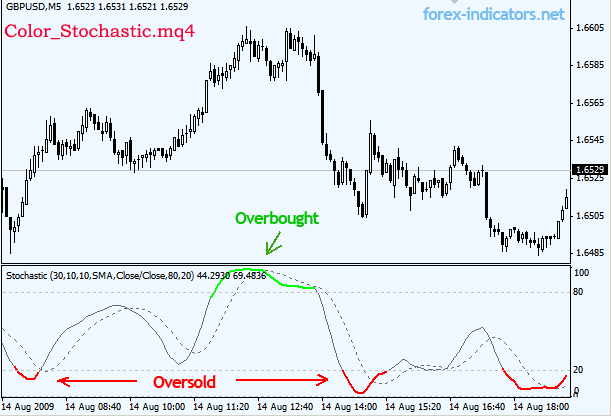
I like this indicator. Can you add sound alerts if they get out of 80 and 20 overbought/oversold lines?
Always liked your indicator reviews. Thanks.
Sure, Stochastic indicator with the Overbought/Oversold sound alert: Stoch_Alert.mq4
And another version of the same idea:
this time it is a separate call for each line (%K and D%). Each one will sound when reaching certain levels or when crossing each other.
Stoch_Alert_K_Sound.mq4
Stoch_Alert_D_Sound.mq4
What is the difference between this indicator and the xForecaster
Looking at google images, there is absolutely nothing in between those two indicators.
in which time frame we should use this? normaly
from the picture above, he use 5 minutes frame
hi..the standard stochastic i'm using is 8,3,3. i see that u use 30,10,10. will it have any impact if i were to change to 30,10,10? thanx bro..
It'll slow and widen the Stochastic graph, and yes, it can change the timing of your entries and exits.
There is no "absolute winning setup" for Stochastic. Every trader decides what values to use and what works best for him.
there is no such thing as overbought and oversold..
yea yea,, my comment is not posted..
All comments are posted, but sometimes there could be delays (end of summer a bit hectic). Sorry about the inconvenience.
"Overbought" and "Oversold" are just commonly used terms to identify "points of interest" so to speak (in other words, the areas with extreme high/low values).
I agree that it doesn't directly relate to the market being necessarily oversold or overbought, but the fact that we can use this data (no matter how we call it) remains true.
Great Website!!!
To all the people use this indicator on STOCK trading using 1min chart...It works...Remember you are scalping so you must not expect to get like 100 pips in 1min chart...Target should be 3-4 pips...
Enjoy
how do i know when to buy or when to sell using color stock?
Hi,
May I know, how to set to have an alert when line %K exiting from 80 overbought and alerting to sell and when line %K exiting from 20 oversold and alerting to buy?
Thank you:)
Post new comment